Function curves and reliefs
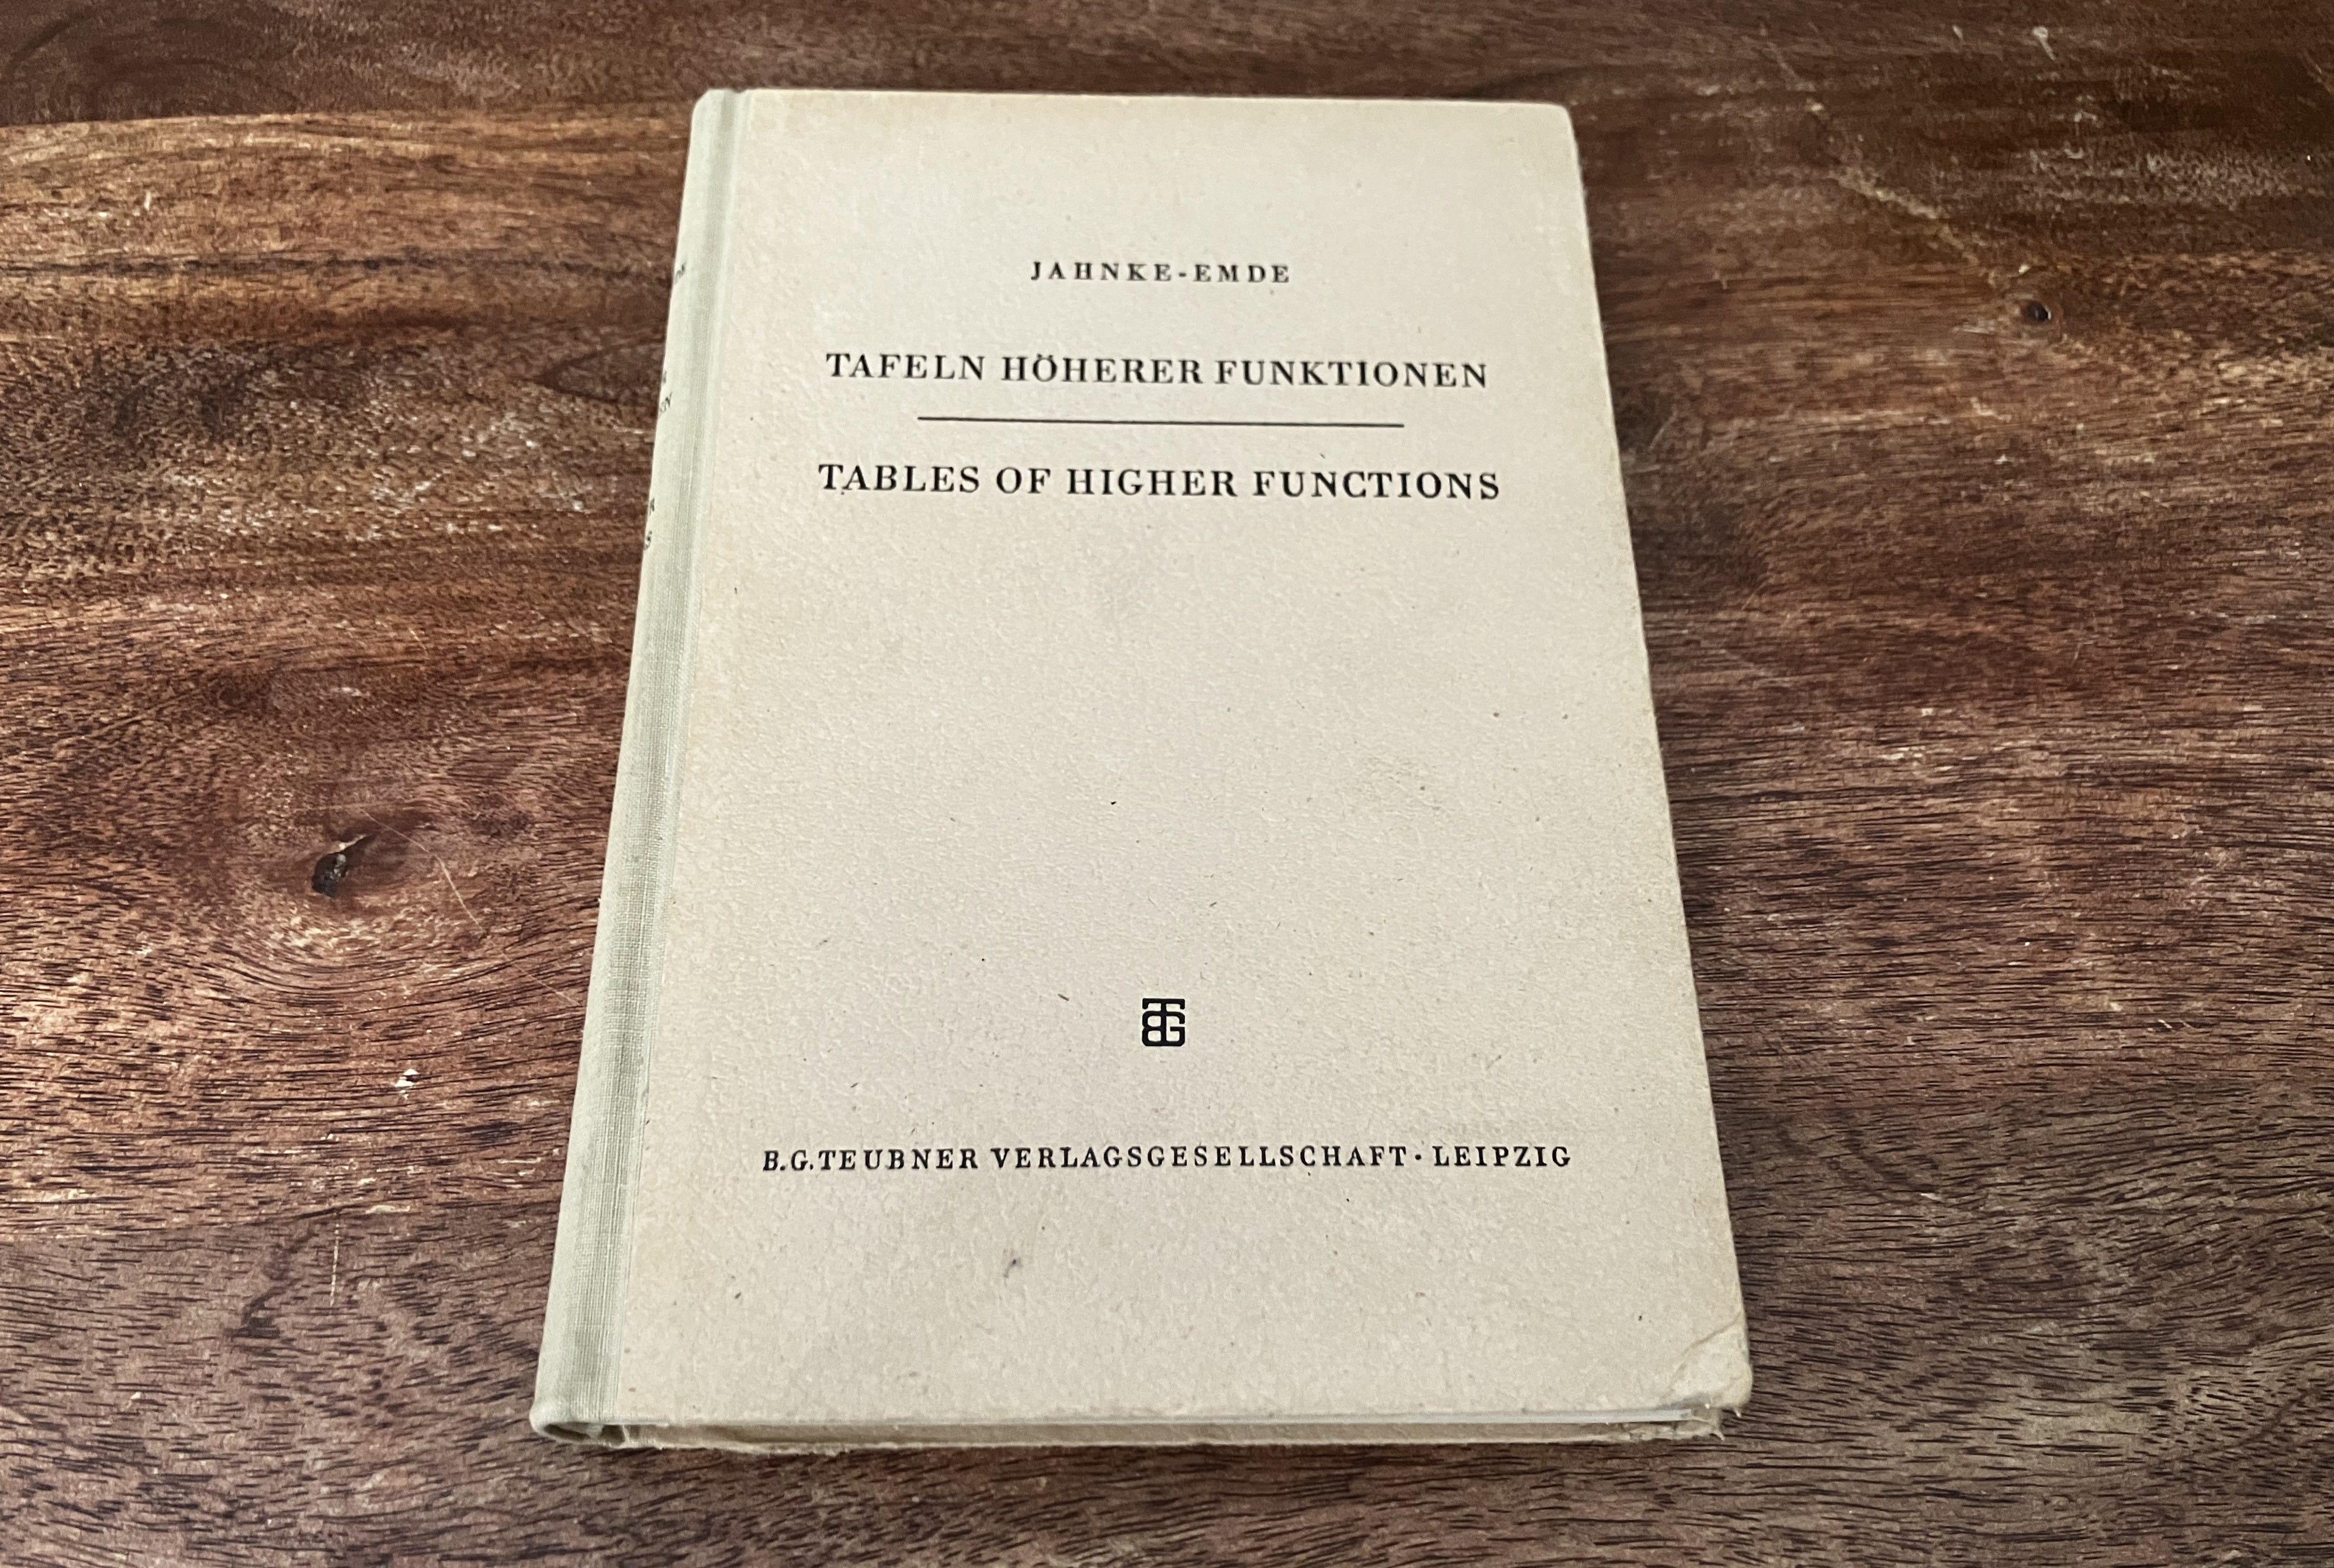
The Jahnke-Emde reference book on functions.

Almost exactly two years ago, I first came across a diagram from the German mathematicians Eugen Jahnke (1861–1921) and Fritz Emde’s (1873–1951) book Funktionentafeln mit Formeln und Kurven (Tables of functions with formulae and curves) on Twitter. Although the work was originally published in 1909, there have been numerous subsequent editions; after reading the English-translation published in 1945 based on the fourth edition (you can borrow it on Archive.org), I decided I absolutely had to add it to my collection. I managed to get my hands on an almost unused 1952 German-English edition published in Lepizig. After Jahnke’s death in 1921, the book was edited by Emde (which is why many people knows it as the “Jahnke-Emde”), and after Emde’s death in 1951, it was edited by Friedrich Lösch, in accordance with Emde’s will. Its title also changed to Tafeln Höheren Funktionen (Tables of Higher Functions).
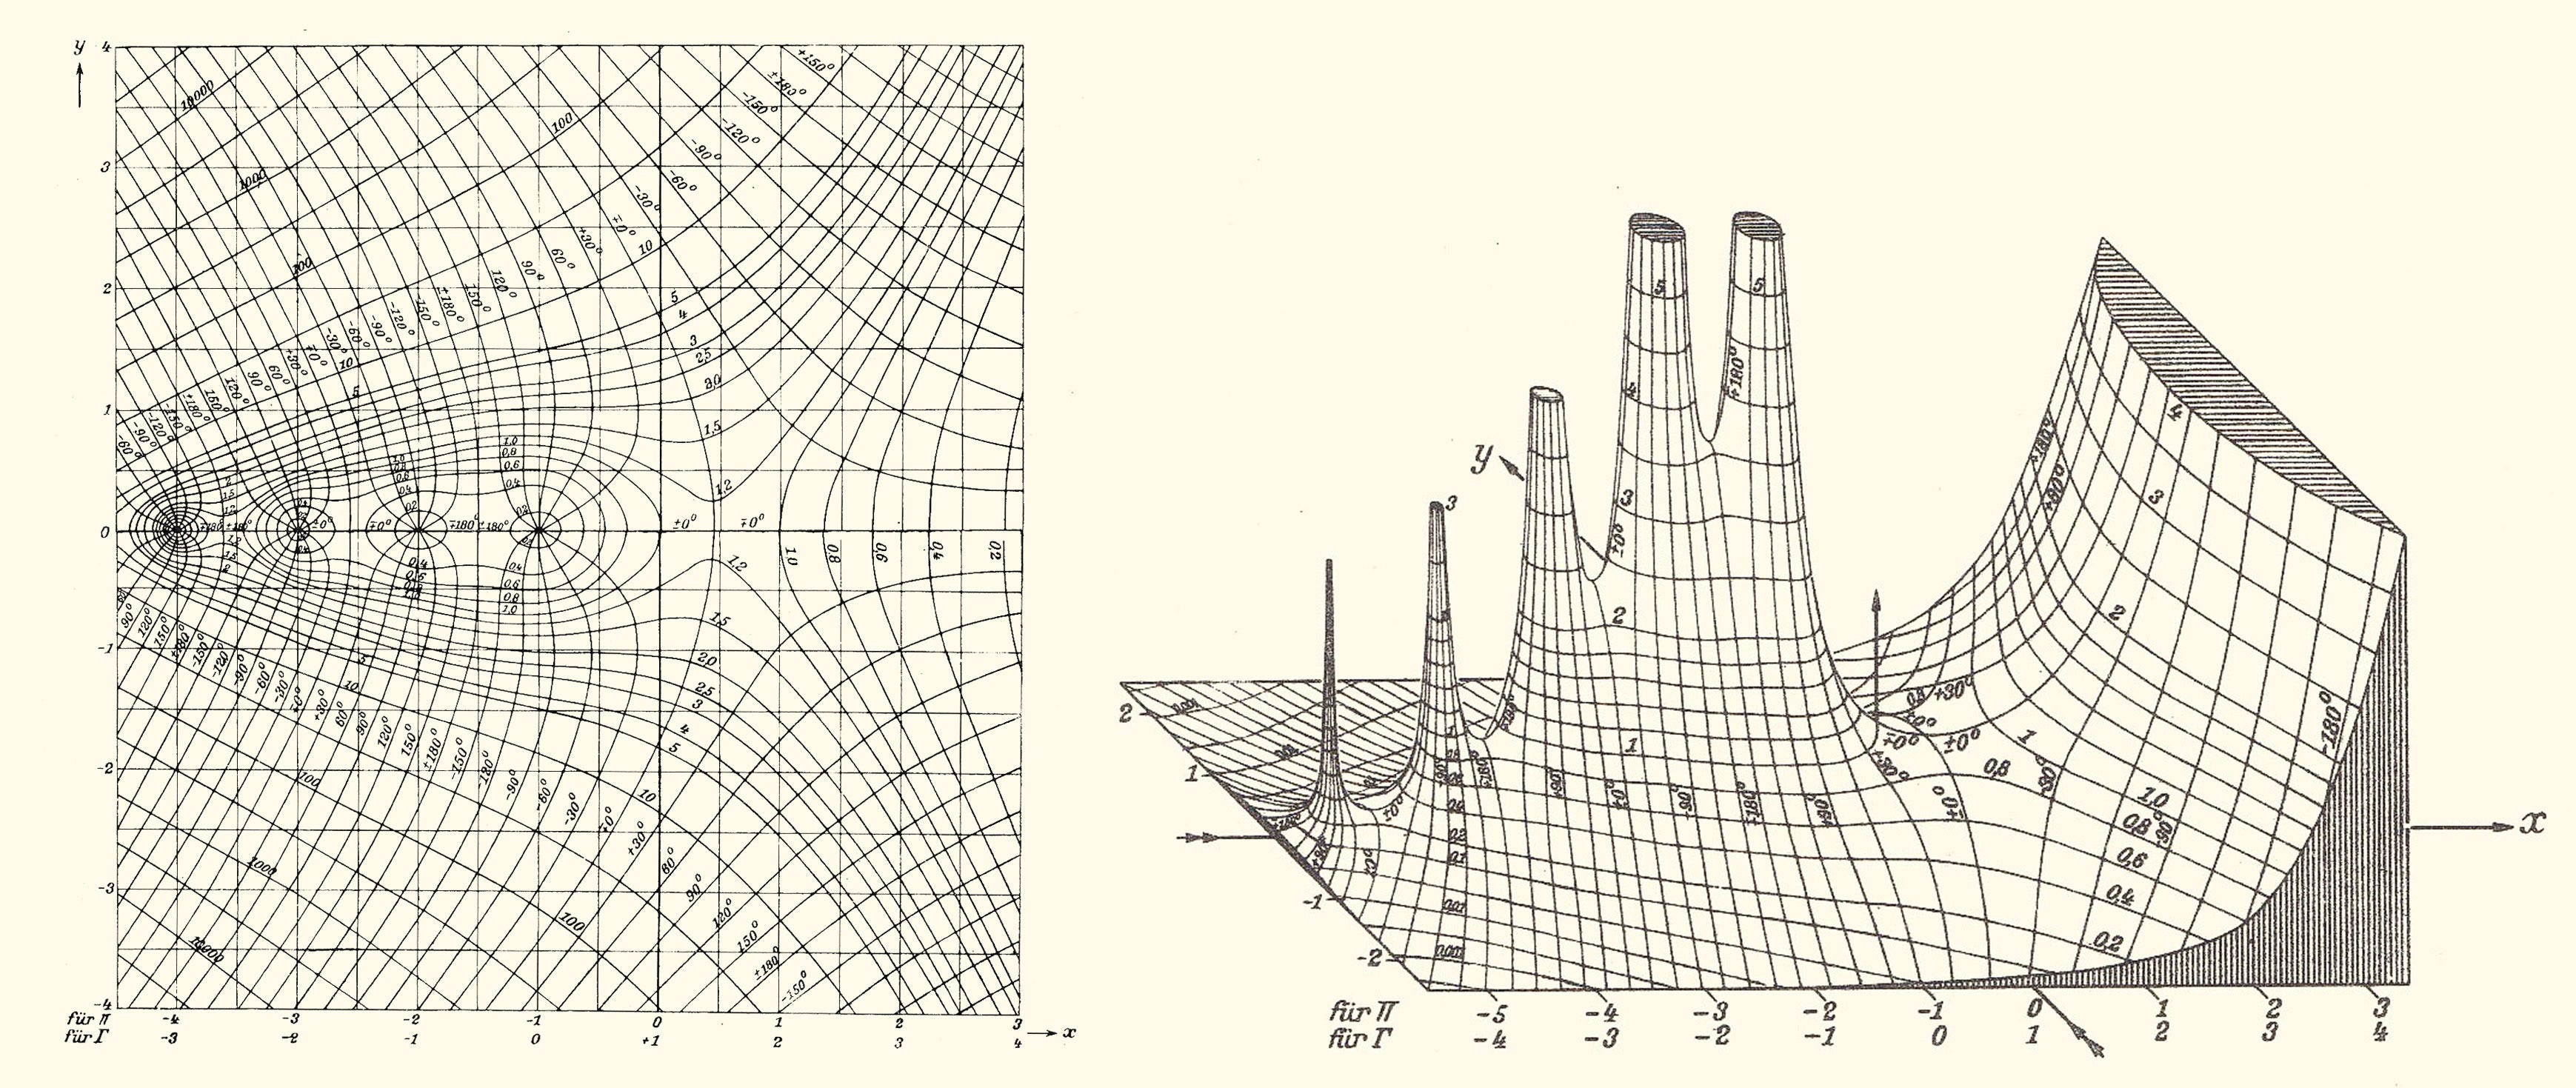
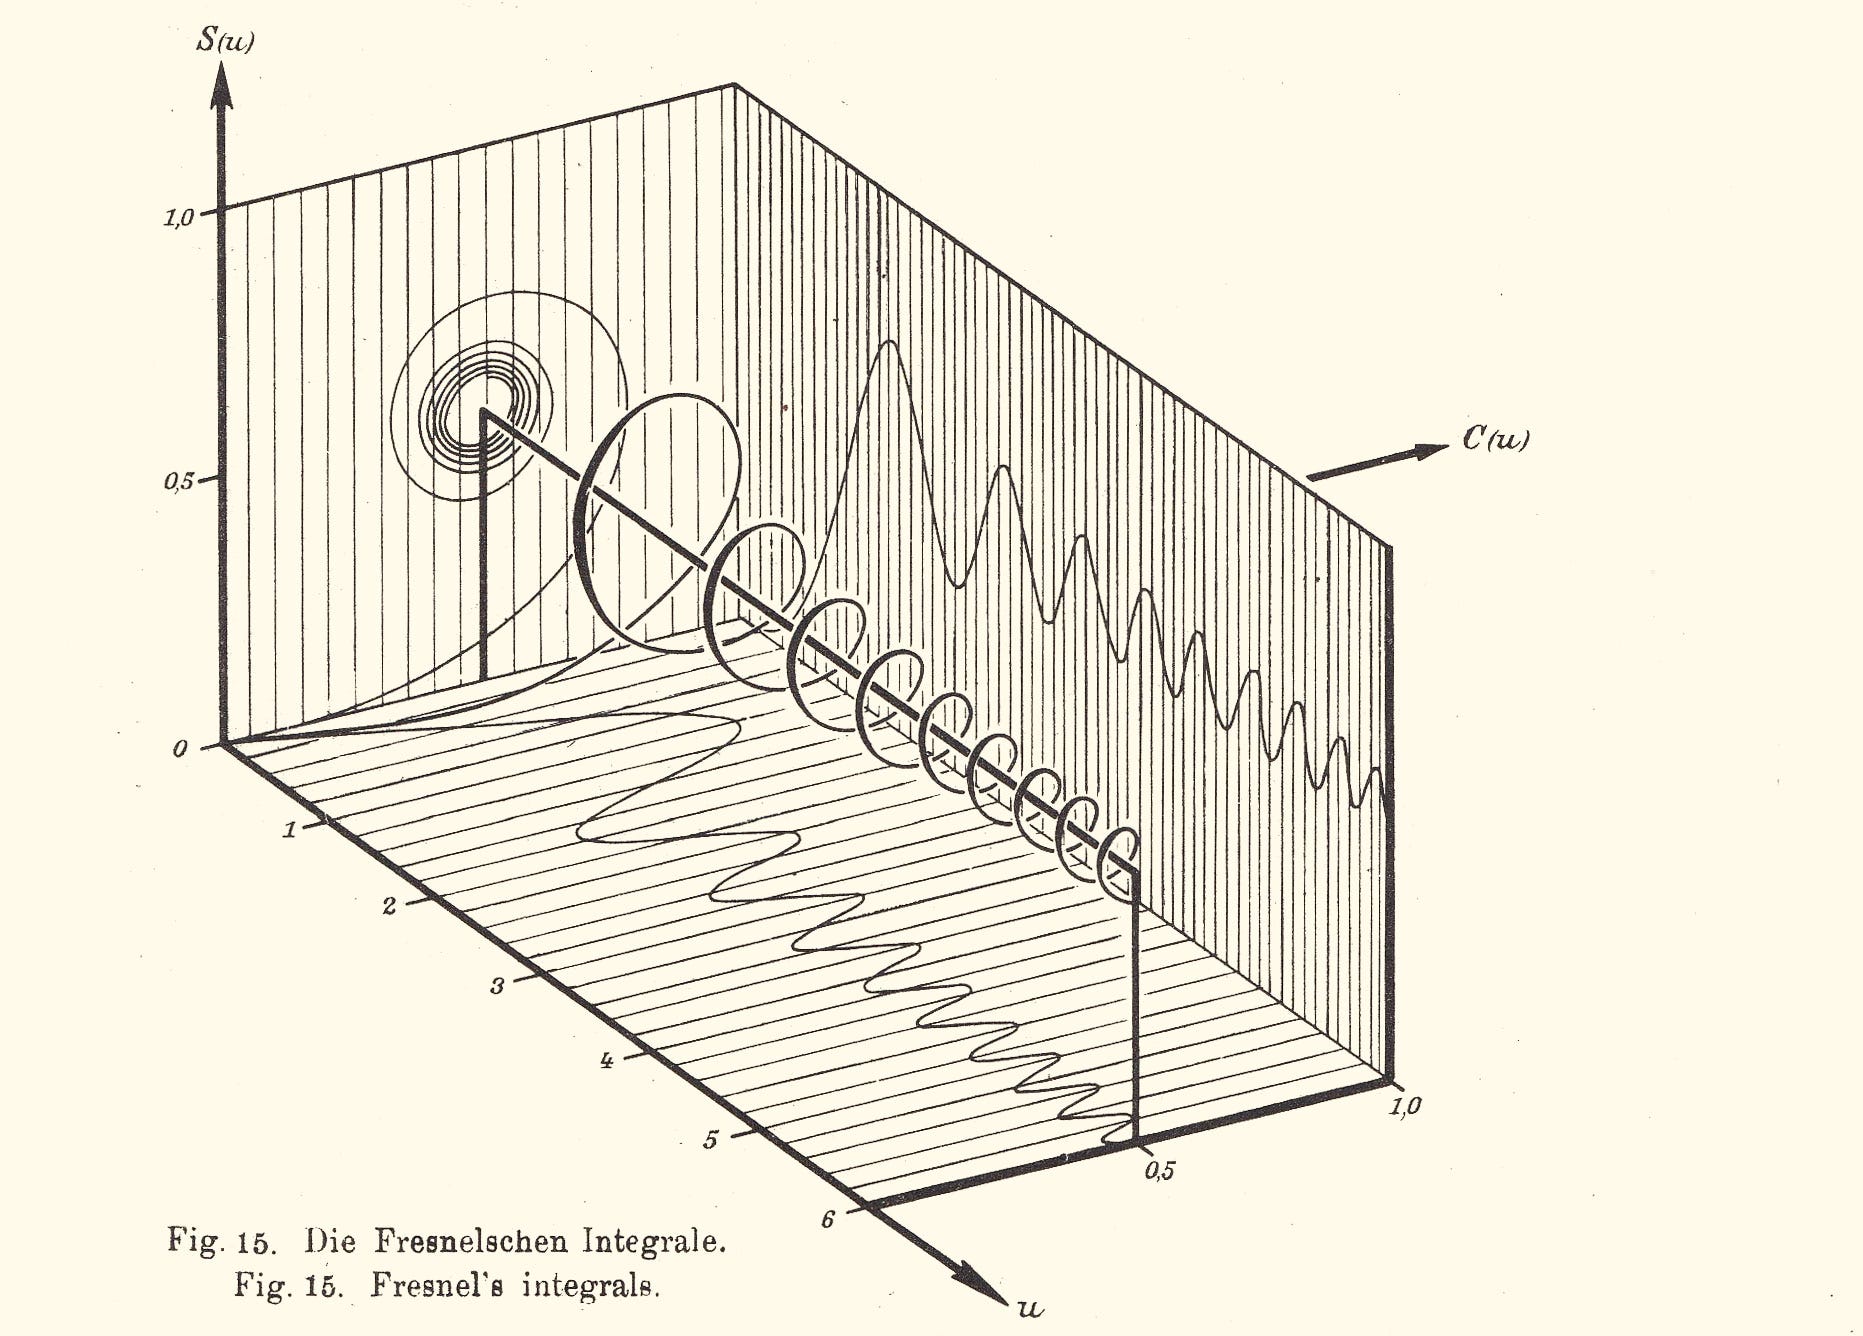
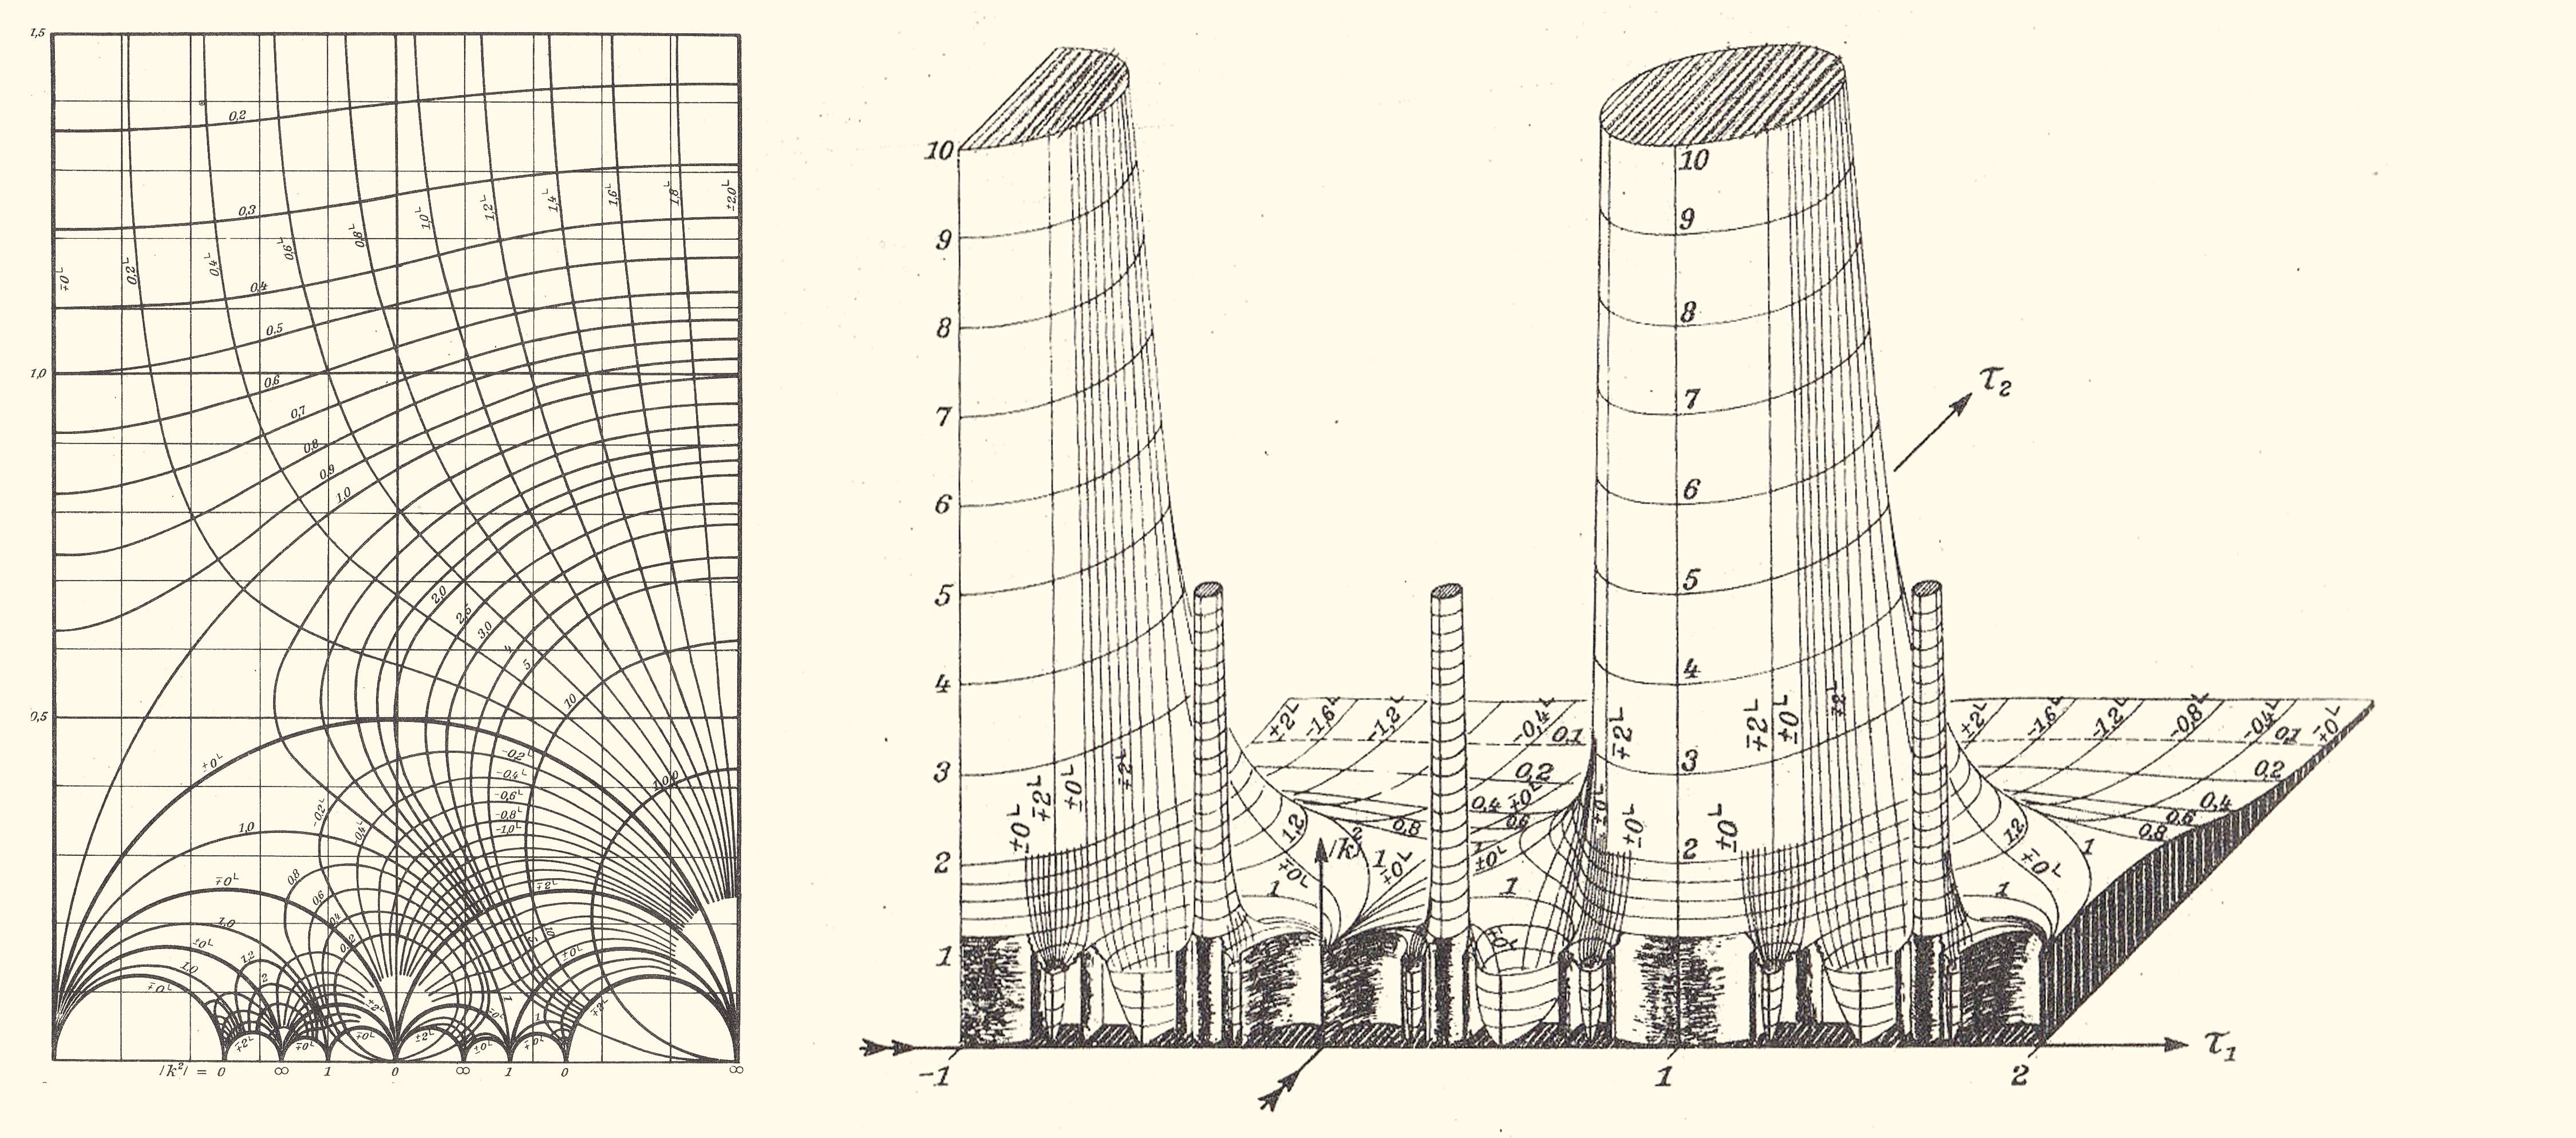
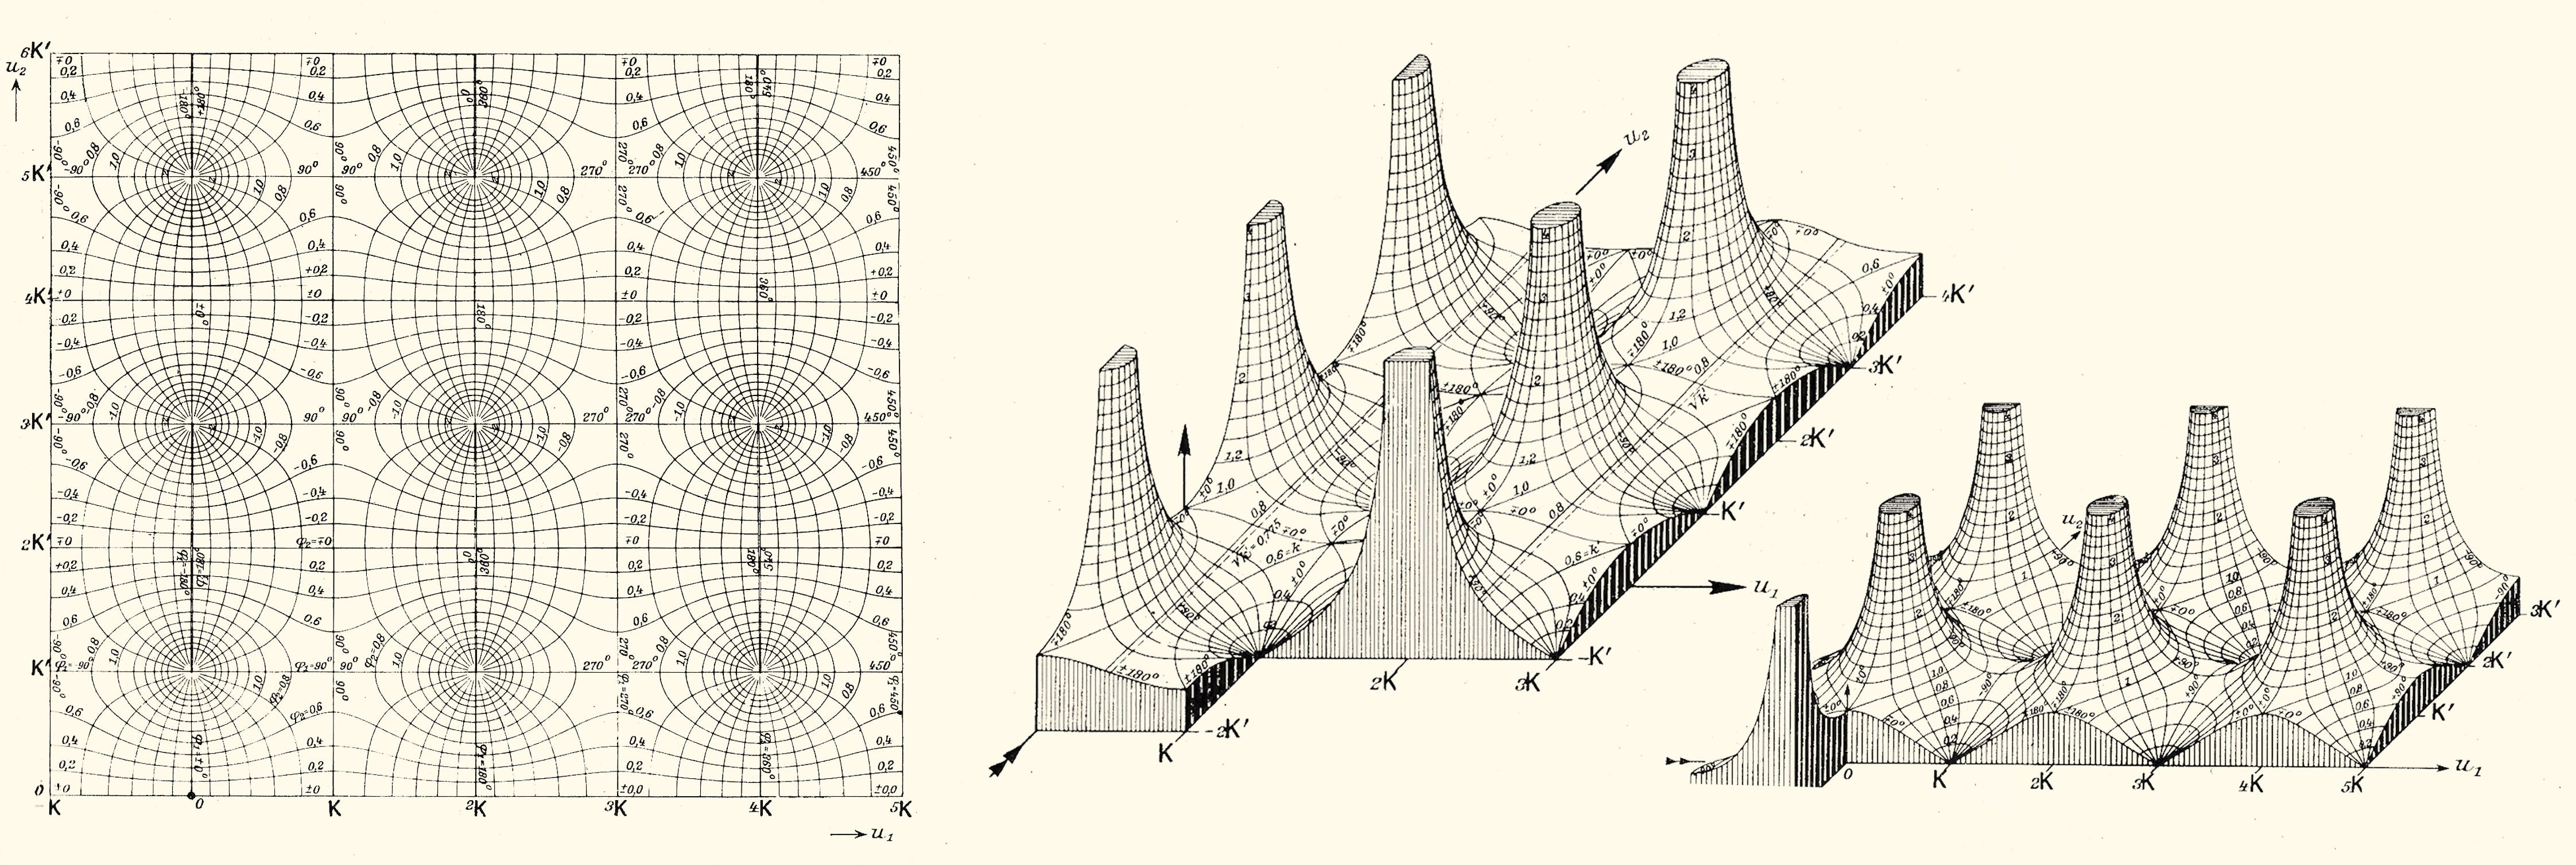
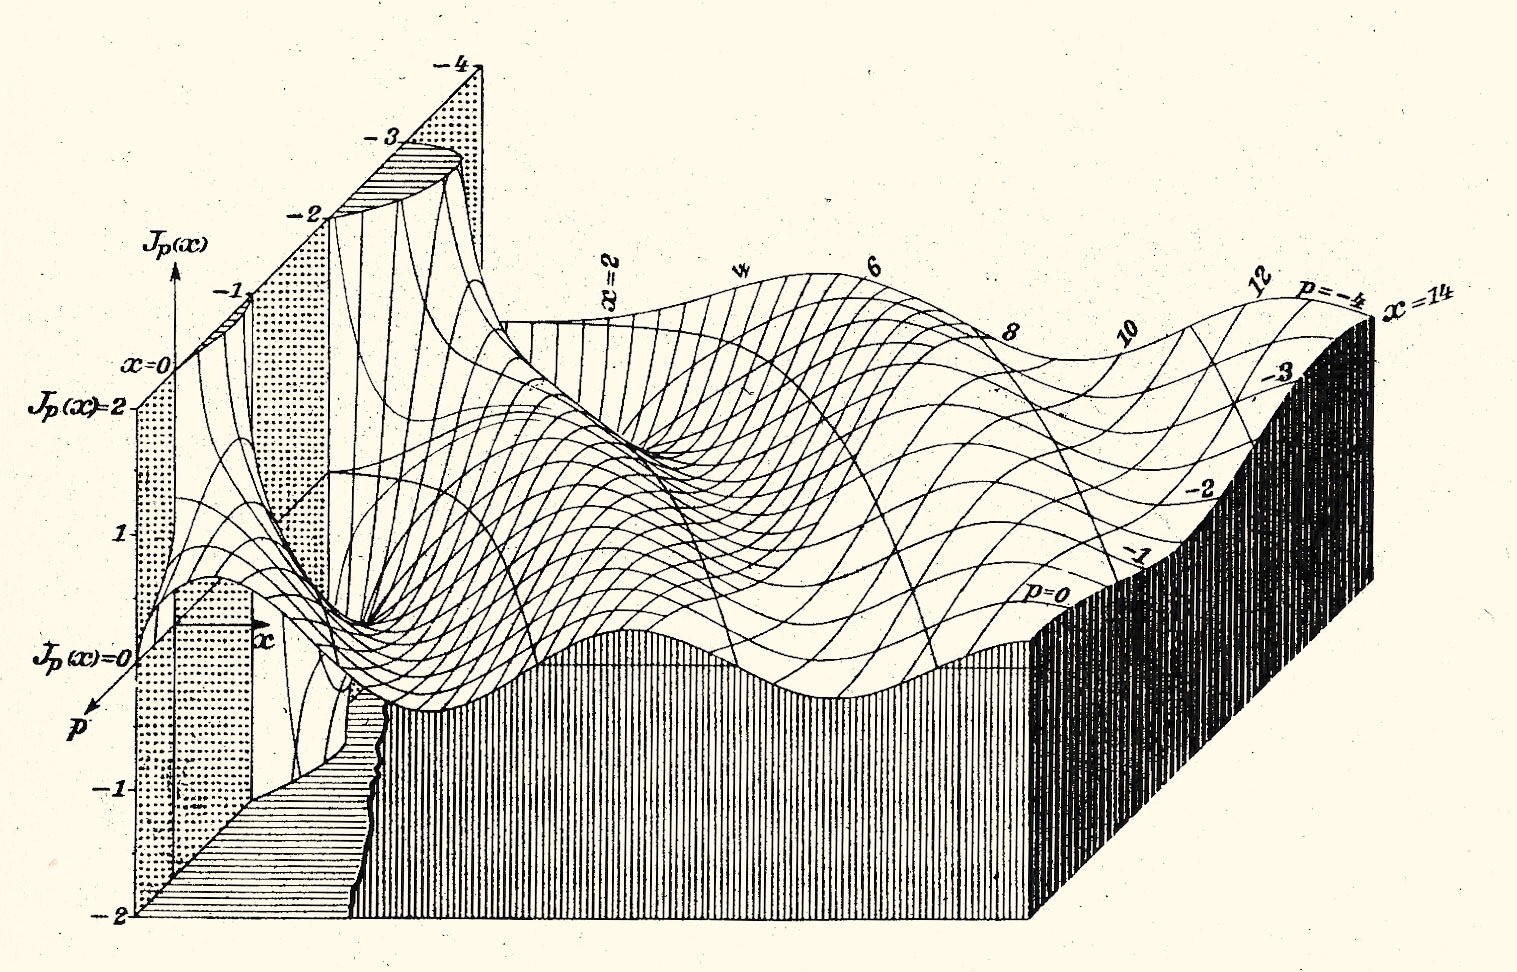
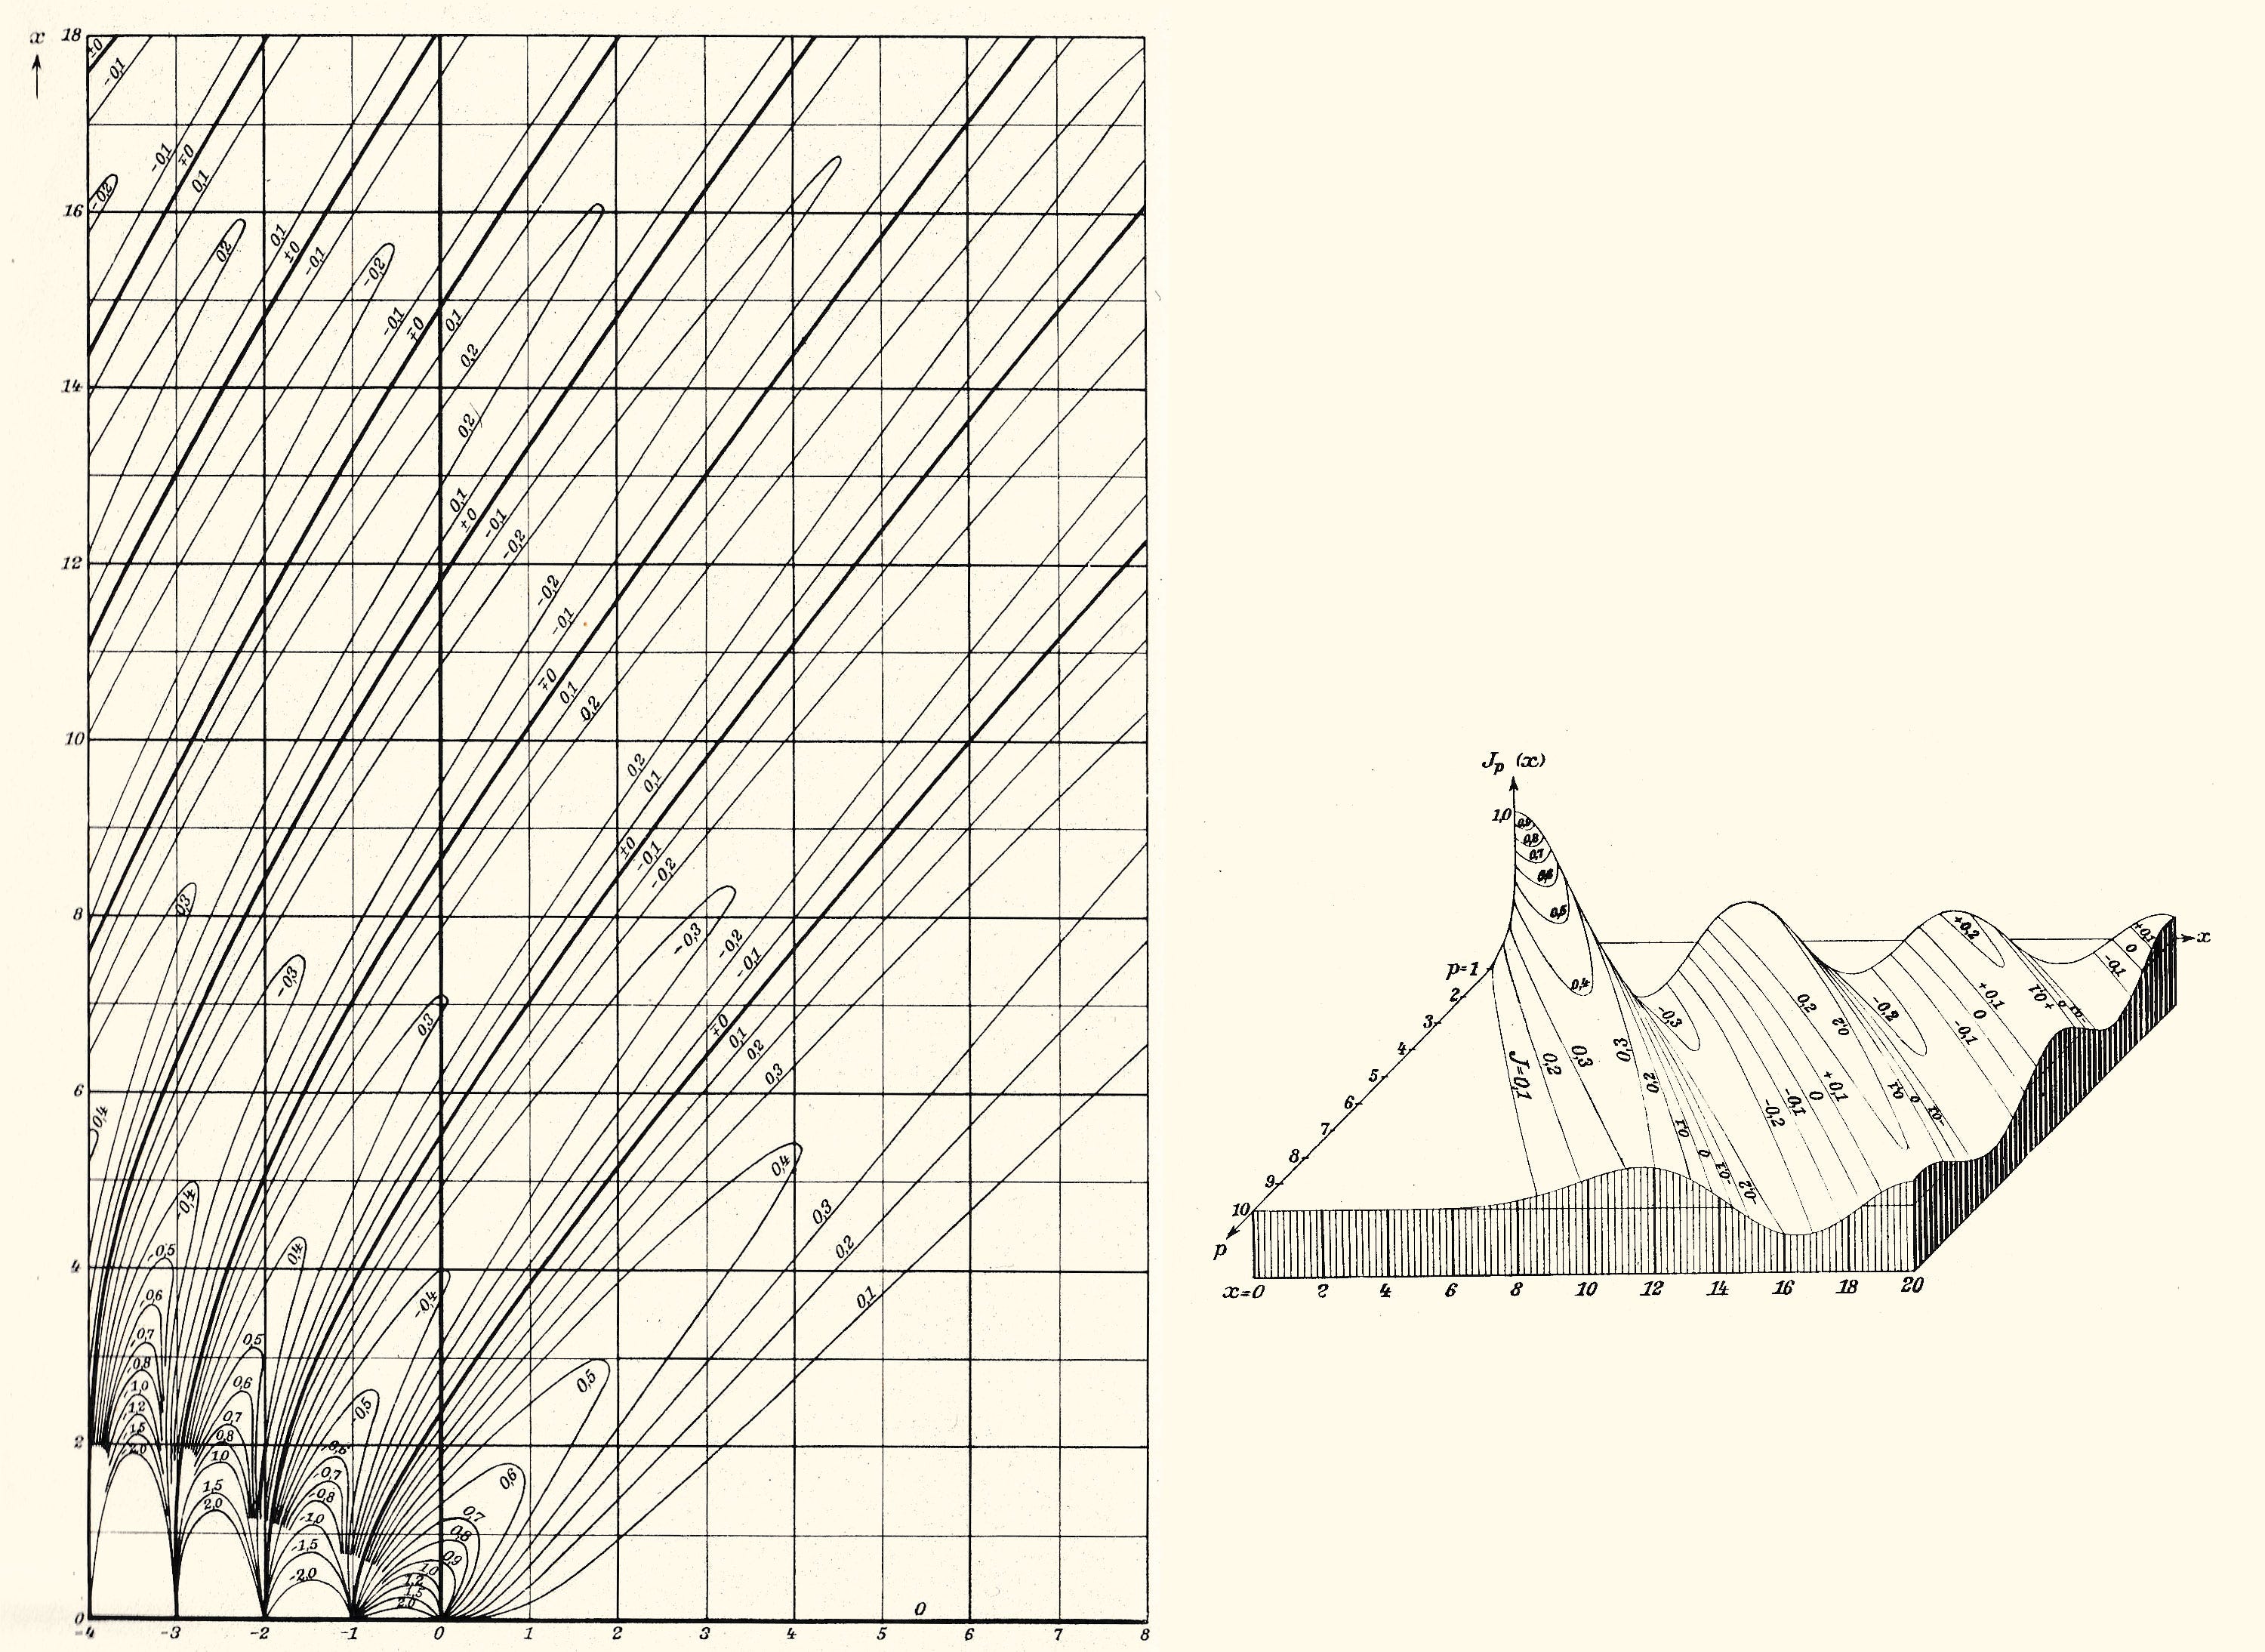
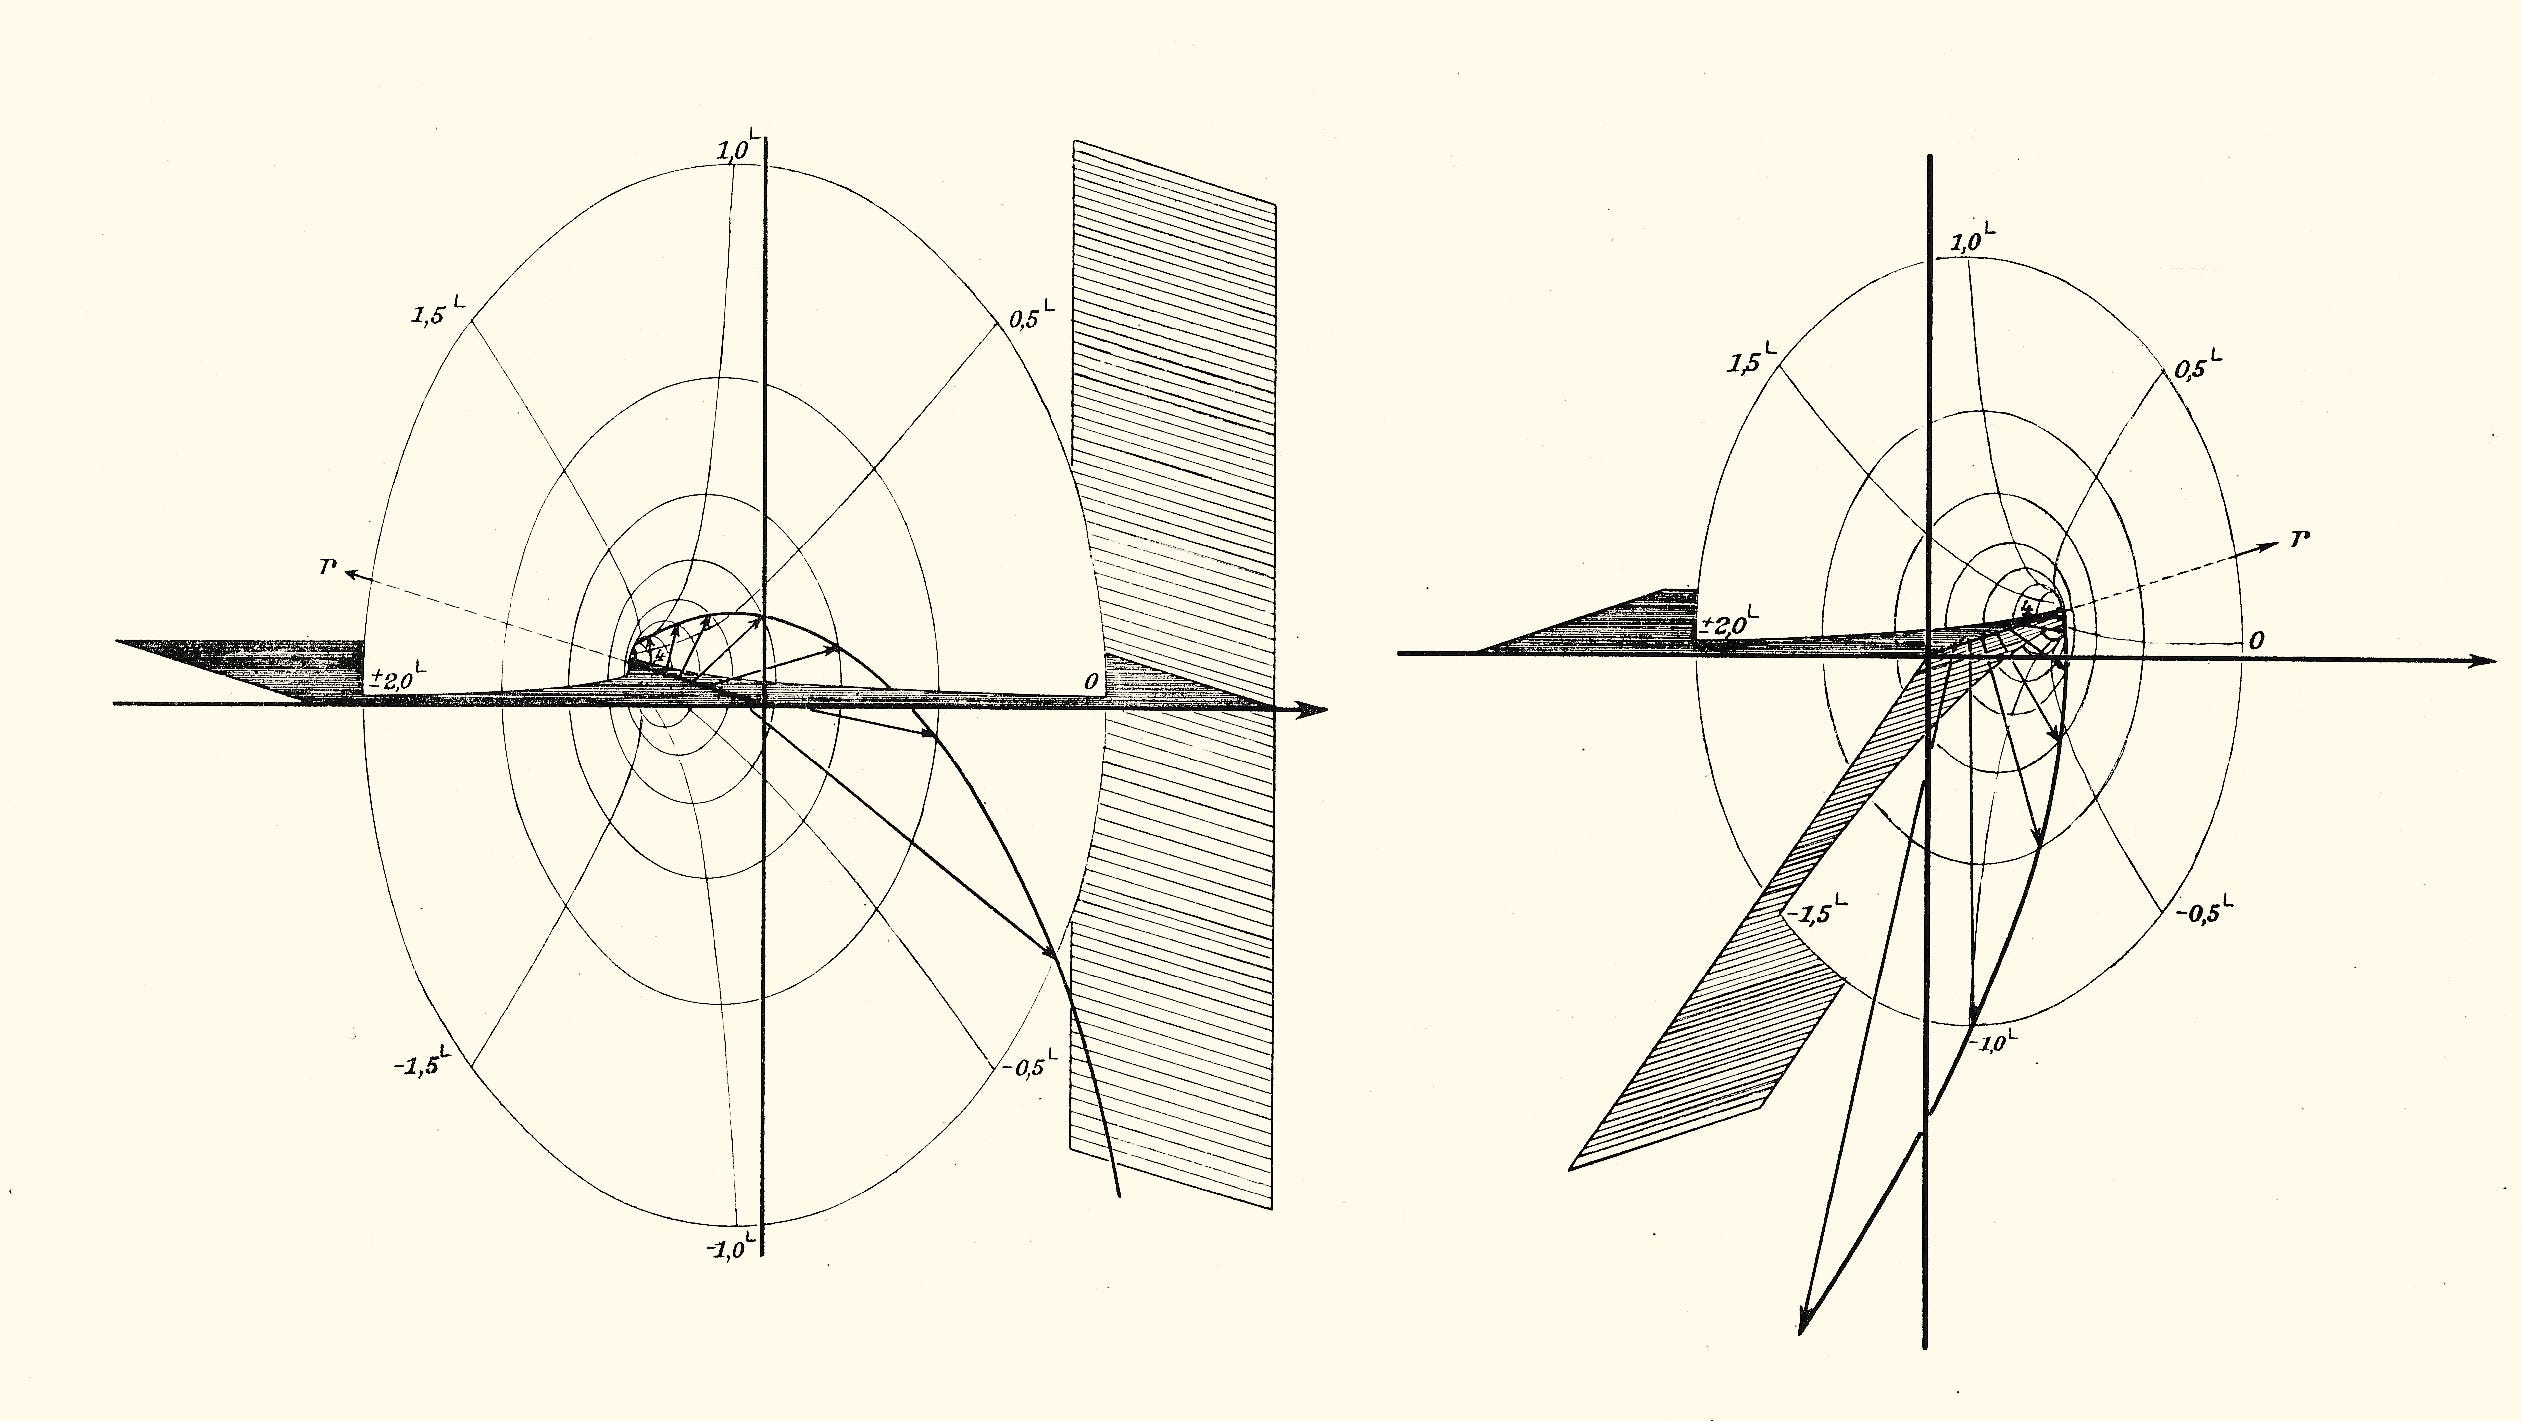
I don’t pretend that I understand what’s in this handbook. As the title tells, it contains function tables and graphs (curves), as well as equations and formulae. I was familiar with the terms “sine,” “cosine,” and “logarithmic integral” up to the first chapter. But that’s obviously not why this book belongs here on the Cabinet of Infographic Curiosities! What makes it particularly interesting aren’t the traditional function graphs in a Cartesian coordinate system, nor even the beautiful diagrams that look like sewing patterns called '“altitude charts”. What’s impressive about it are the 3D versions of those altitude charts, as they are called in the book: reliefs. The book contains 177 graphs and diagrams, here are my favourites so far.
When it comes to statistical diagrams, Luigi Perozzo’s “stereogram” is the first thing that comes to my mind. I recommend that everyone read RJ Andrews’ two-part article on Perozzo’s 3D statistical charts and how RJ recreated them.

But without these functions, cartography would not exist either. The Jahnke–Emde function tables contained many specialized functions (logarithms, trigonometric functions, elliptic integrals, etc.) that were regularly required in engineering, geodesy and cartography. Let us not forget: map projections, curves, and terrain and elevation models are functions too!
News
I have been invited to the Information Design Conference, where I will be speaking about Cabinet of Infographic Curiosities. The conference will take place on October 30, 2026, in Hilversum, the Netherlands. So far, they’ve announced me and the fantastic James Cheshire.

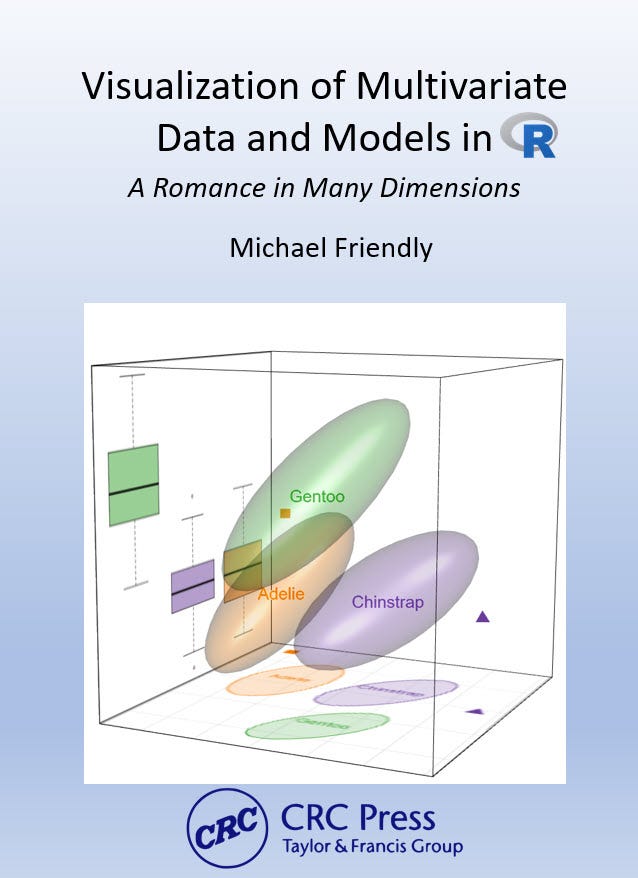
Our papa, Michael Friendly has a brand new book, Visualizing Multivariate Data and Models in R. The final print version will be published by CRC Press this year. Until then an online version is already available here with many-many historical examples. Congrats, Michael! You can read my interview with Michael here: