

Hickmann's influence
How the drawing style of a Czech-born statistician spread throughout Europe.

The statistical charts created by the Czech-born geographer and statistician, Anton Leo Hickmann (Terezin, 1834–Vienna, 1906) may be familiar even to those who have only a superficial knowledge of the history of data visualization. I am almost certain that most people have already encountered Hickmann’s pictorial charts, even if they did not realize at the time that they were Hickmann’s works. Hickmann’s statistical atlases and other graphic works were extremely popular in the late 19th and in the first half of the 20th centuries, and were the subject of numerous reprints, editions, and translations to English, Czech, Romanian, Hungarian or Russian languages. In my view, however, Hickmann’s influence extends far beyond this. His graphic solutions, forms, and his style also appear in numerous other works of the same or later periods.
As I wrote earlier, it is difficult to pinpoint Hickmann’s exact place in the chronology of pictorial statistics. Clearly, Hickmann was not the first to use this method. The heyday and popularity of Hickmann’s atlases coincided precisely with the period when pictorial statistics was taking its first steps following the publication of George Mulhall’s 1884 Dictionary of Statistics. Richard Peale’s Popular Compendium series with pictorial statistics and 3D diagrams was launched in 1883, and Randy McNally and Co. also published atlases and brochures with these types of graphics from the late 1880s. I also know isometric statistical diagrams from Chile and Argentina dating from the early 1890s.
If we treat both Mulhall, Peale and McNally as separate stages, then Hickmann represents the 19th-century culmination of pictorial statistics in this process. While Mulhall’s work still consists of schematic pictograms, Peale’s and Rand McNally’s publications give them form and substance. In Hickmann’s work, finally—I can’t think of a better word for it—they possess a sense of decorum. Hickmann’s drawings are not only detailed and elaborate, but in some of his publications, the illustrations are even given gold and silver accents that glisten in the light.
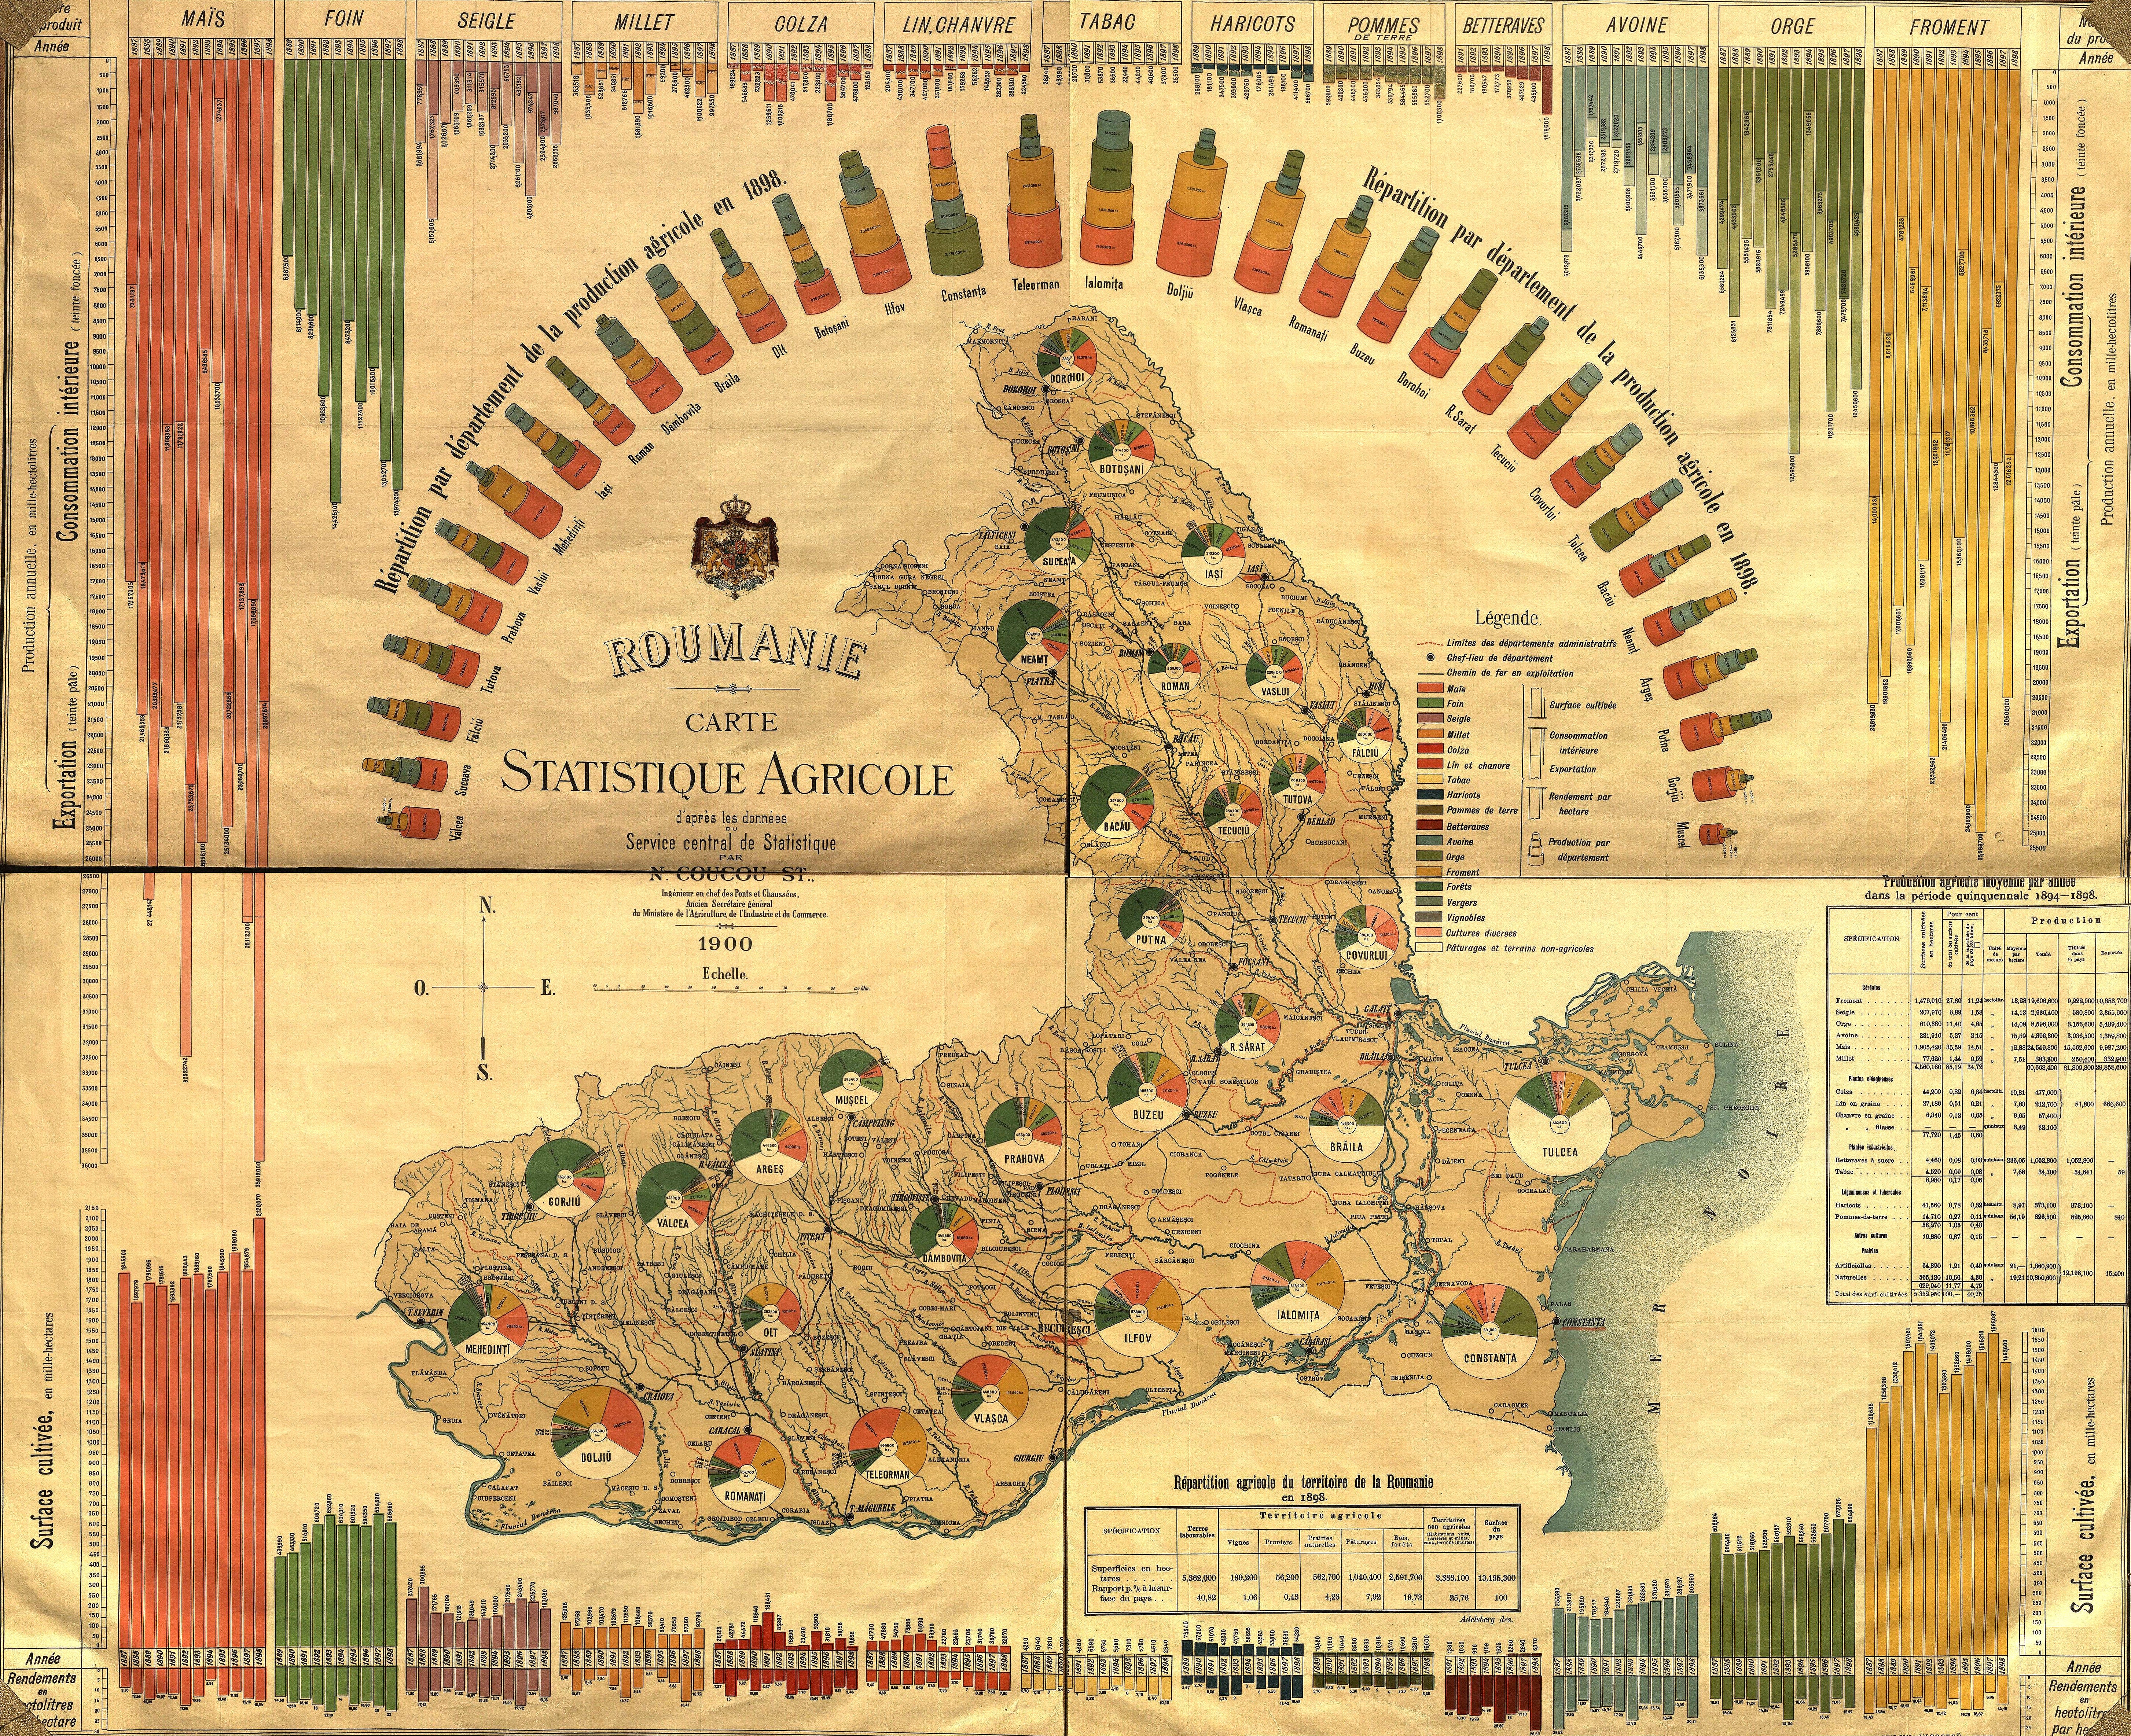
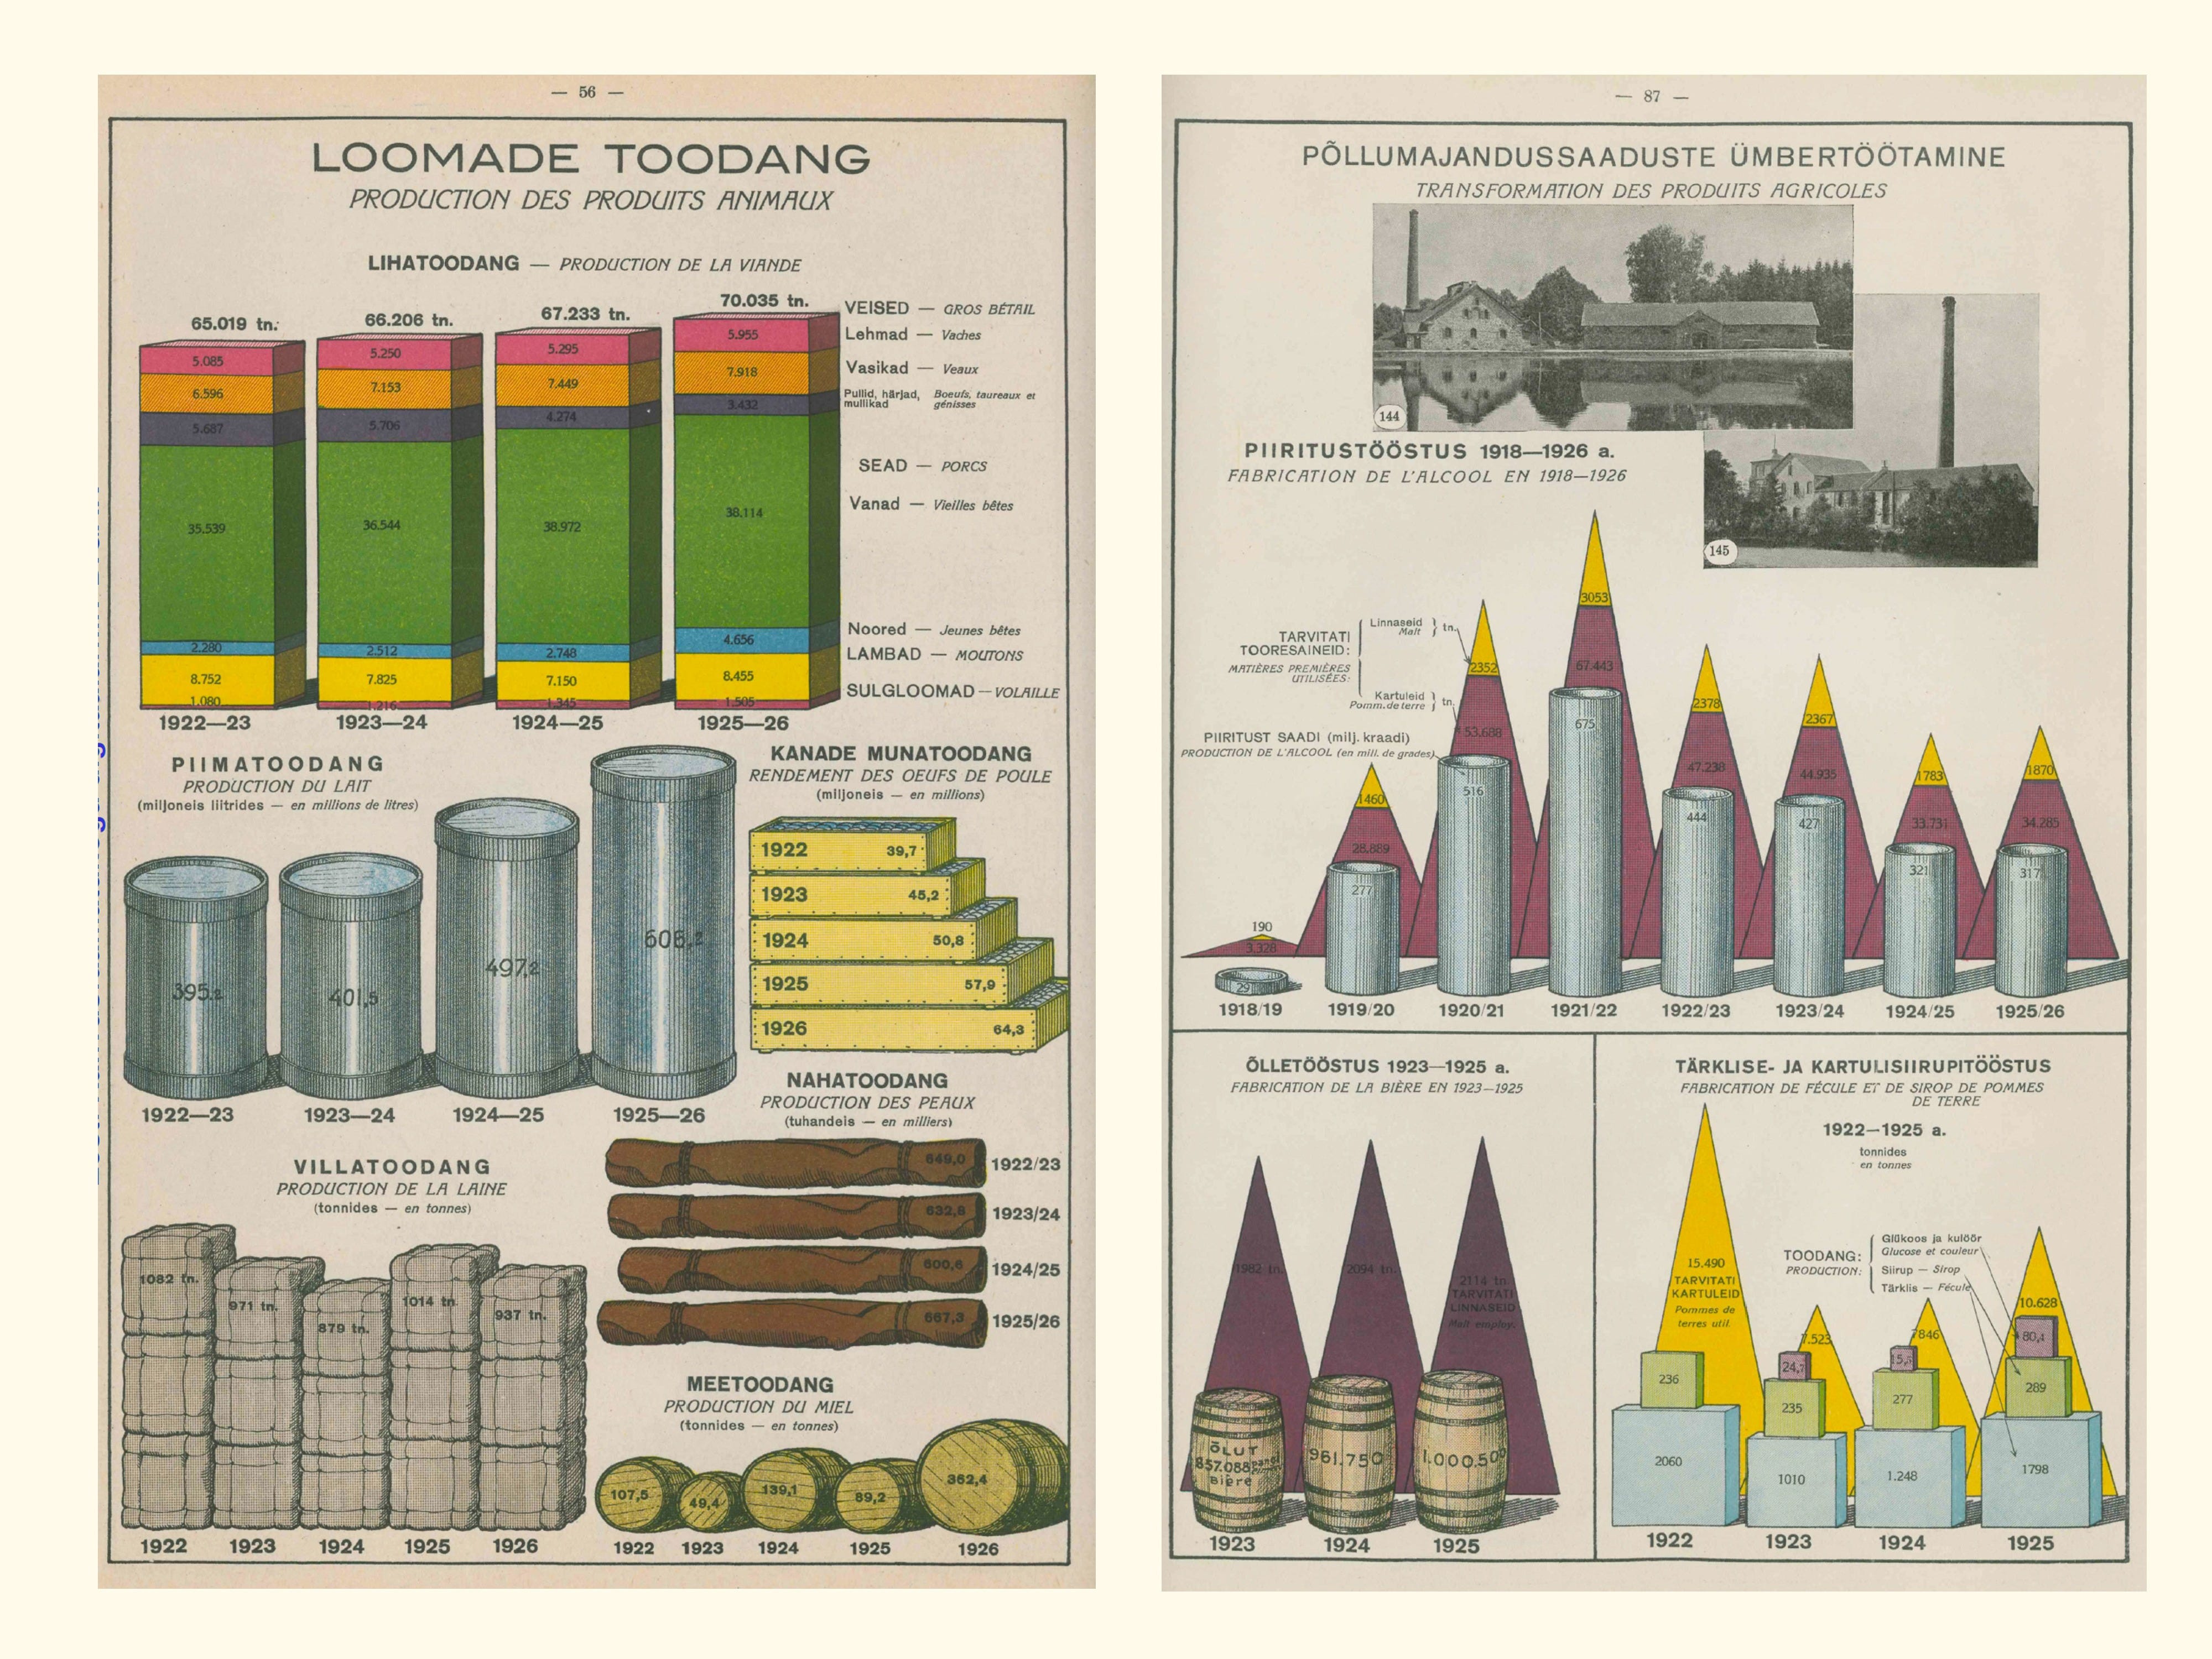
In this post, I am not praising Hickmann’s own work—others have done that on the internet many times before me, most lately the Belgian information designer Koen Van den Eeckhout on LinkedIn. I want to draw attention to how Hickmann’s graphic style and design choices appear in other statistical publications. His impact is obvious and striking when one digs into European archives. I found publications in Romania, Hungary, Russia, Latvia, Lithuania, and Estonia that either copied Hickmann’s pictorial statistical charts and dashboard-like pages or were very similar to them. This style-analysis and formalist method in pictorial statistics, borrowed from art history, is of interest to us precisely because it rarely works with abstract, diagrammatic statistical representations. Consequently, in Hickmann’s case, it is possible to outline his actual influence—which extends primarily to Eastern Europe—with a fair degree of precision.
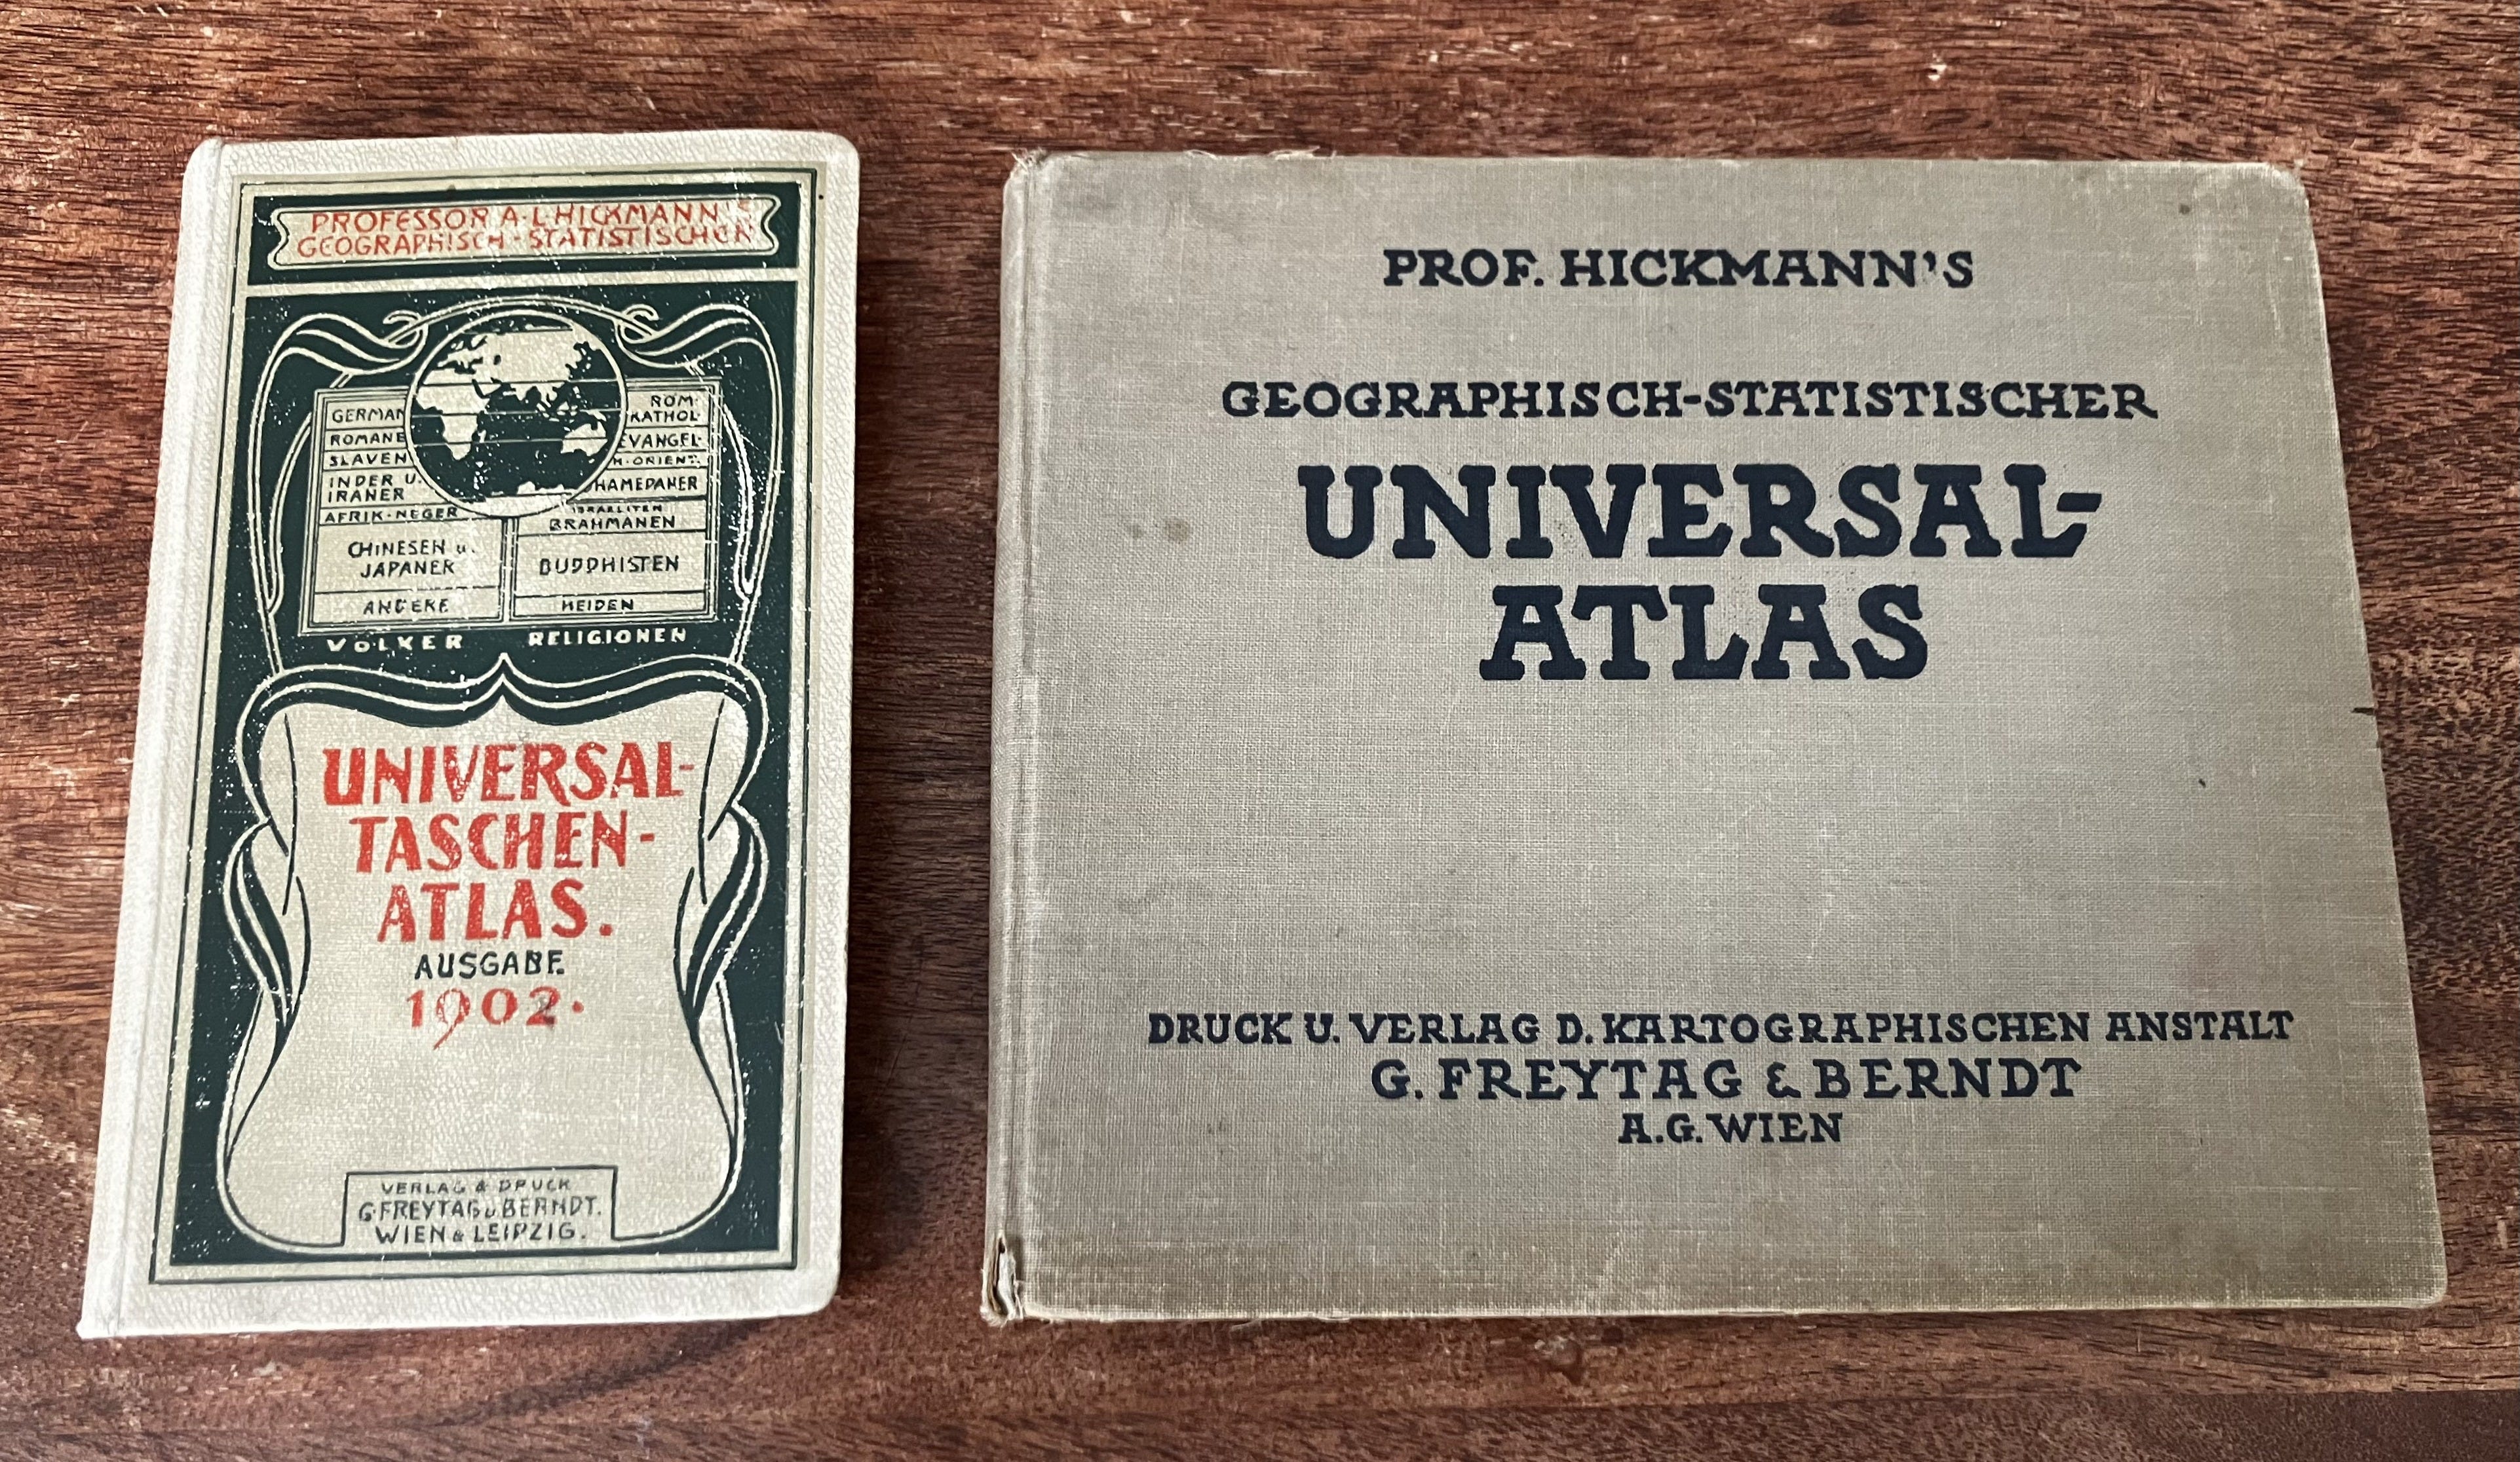
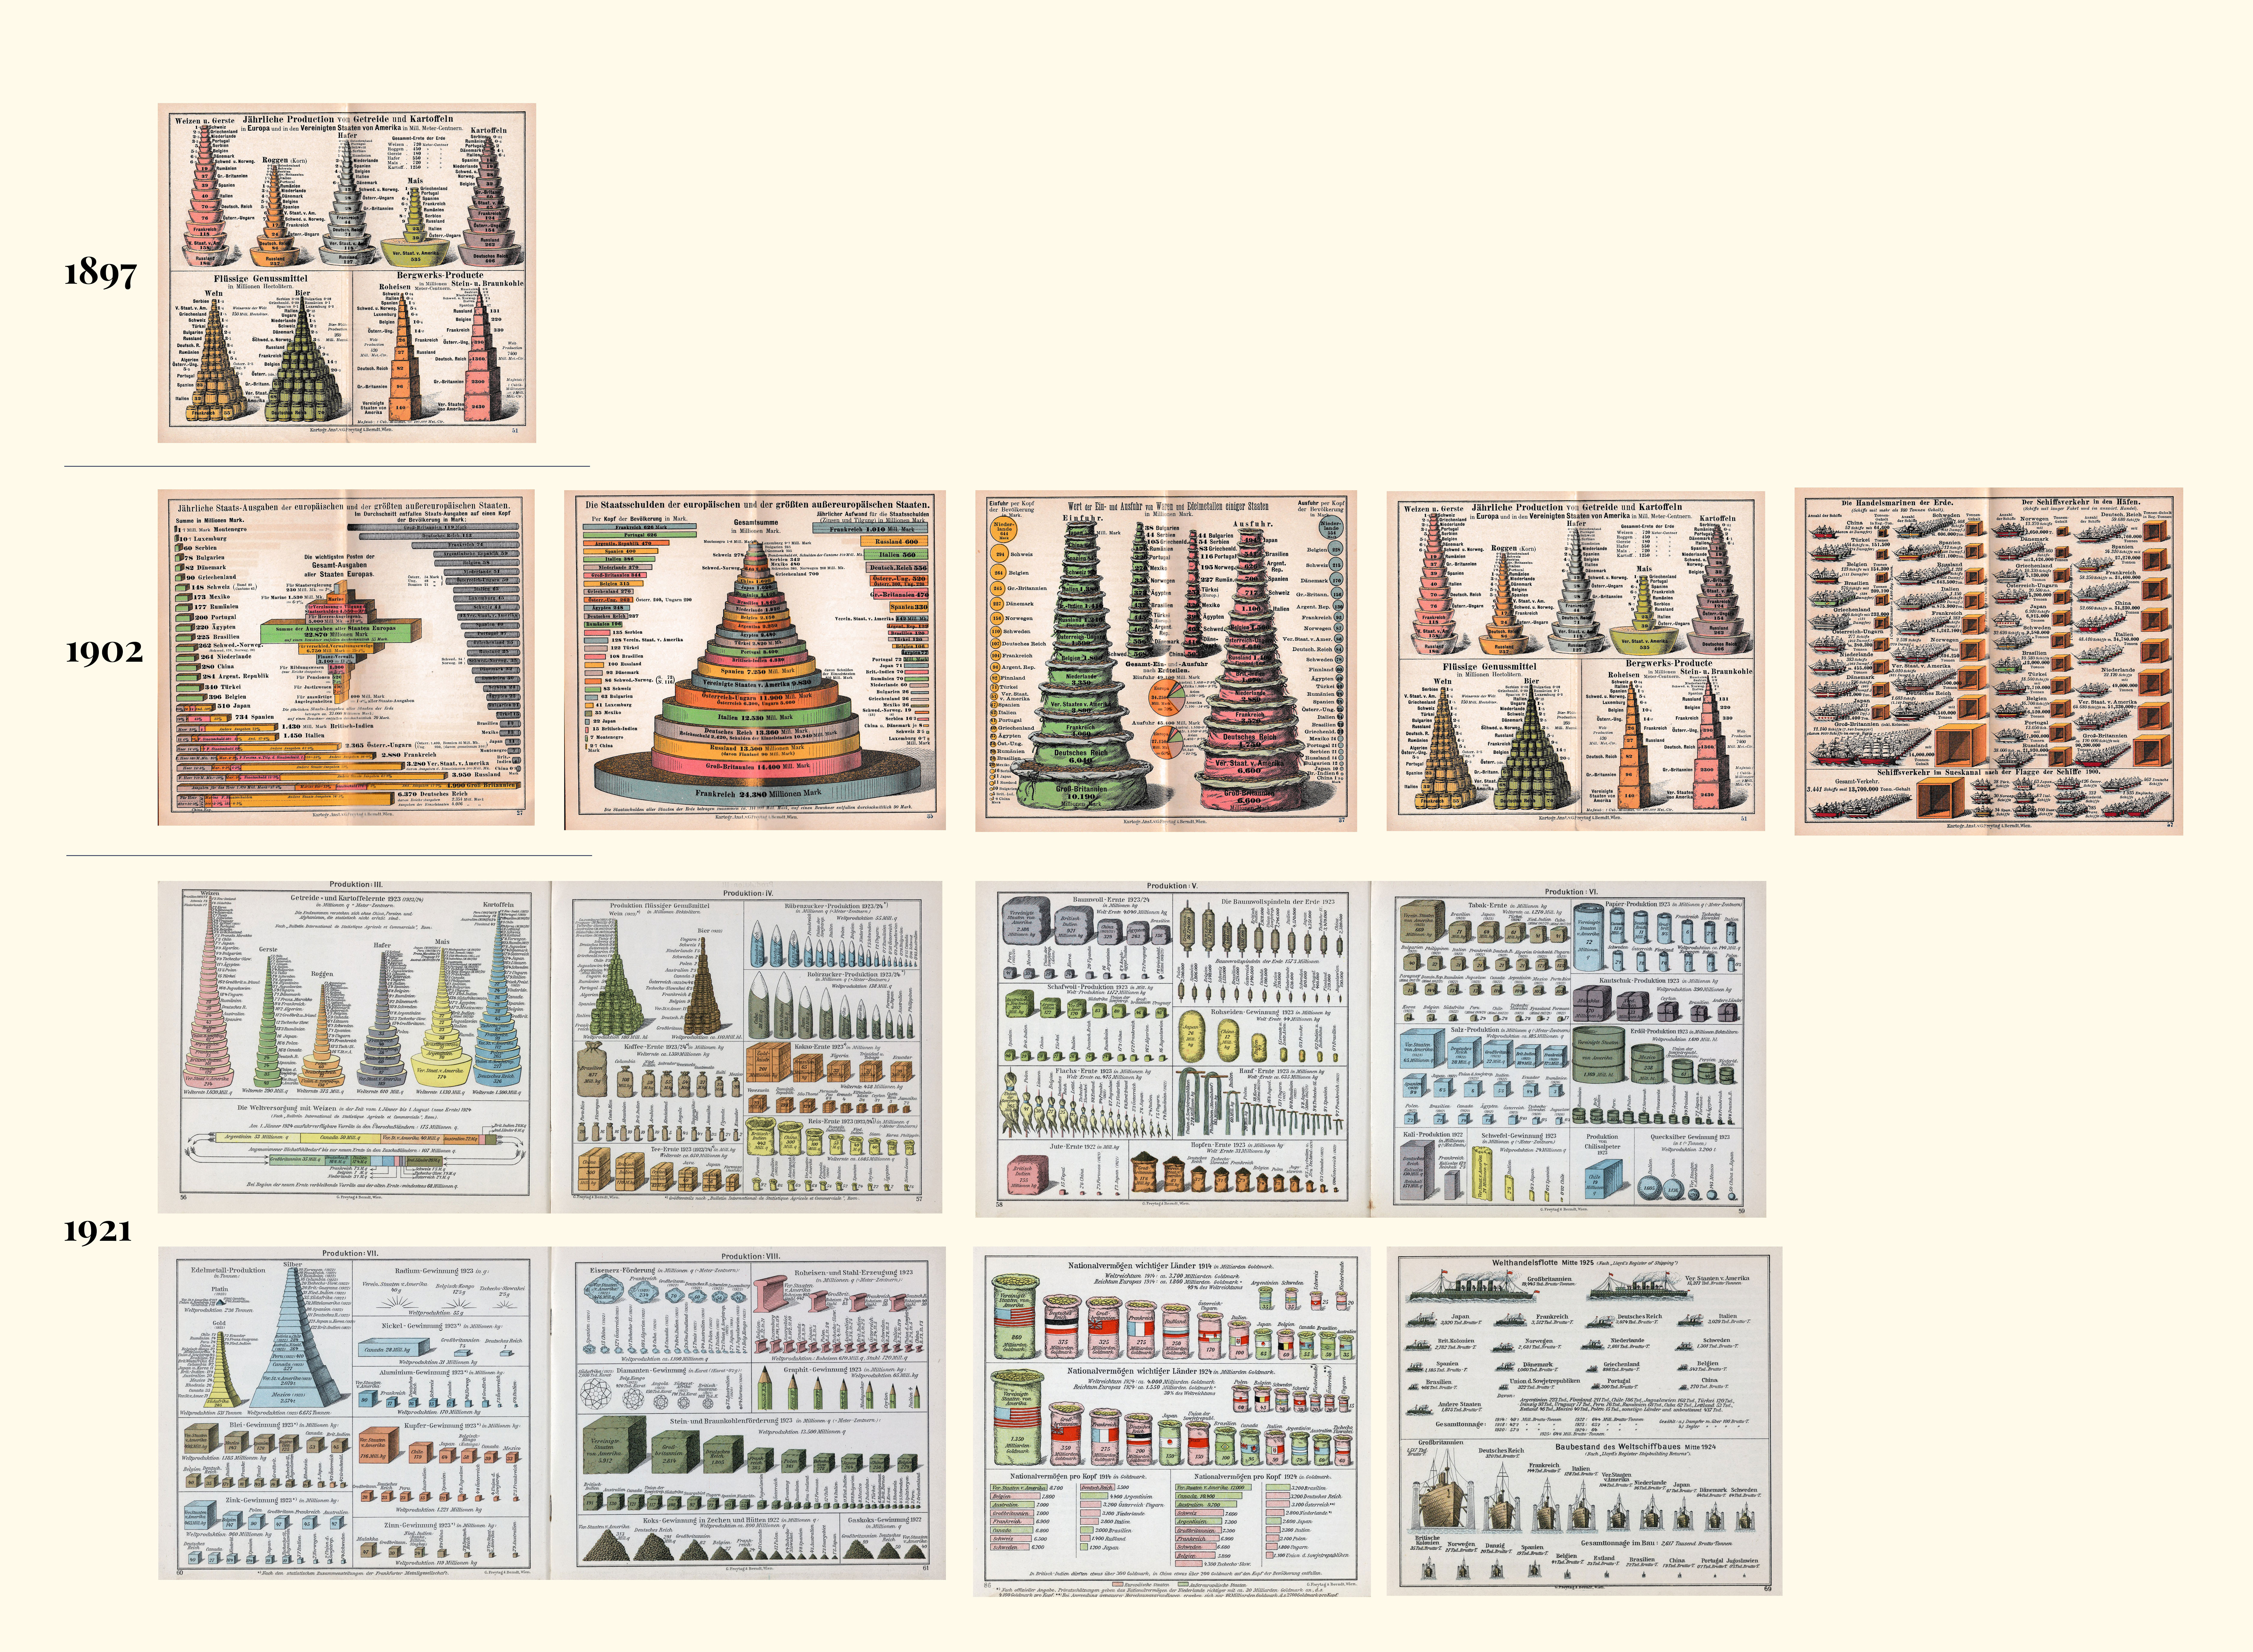
Hickmann’s most influential work was the Geographisch-statistischer Universal-Taschen-Atlas, published in 1894 by the prestigious Viennese map publishing house, Freytag & Berndt. Czech, Hungarian and Romanian translations of the pocket atlas began to appear in 1897, and after 1900, subsequent editions—published after Hickmann’s death in 1906 under the revision of the statistician and geographer, Neurath-colleague Alois Fischer1—were also translated into English, French, and Russian. The atlas went through at least ten editions between 1894 and 1931. The last edition of the pocket-size series was published in 1909. It was relaunched in 1921 in a larger format, now with the collaboration of Fischer.
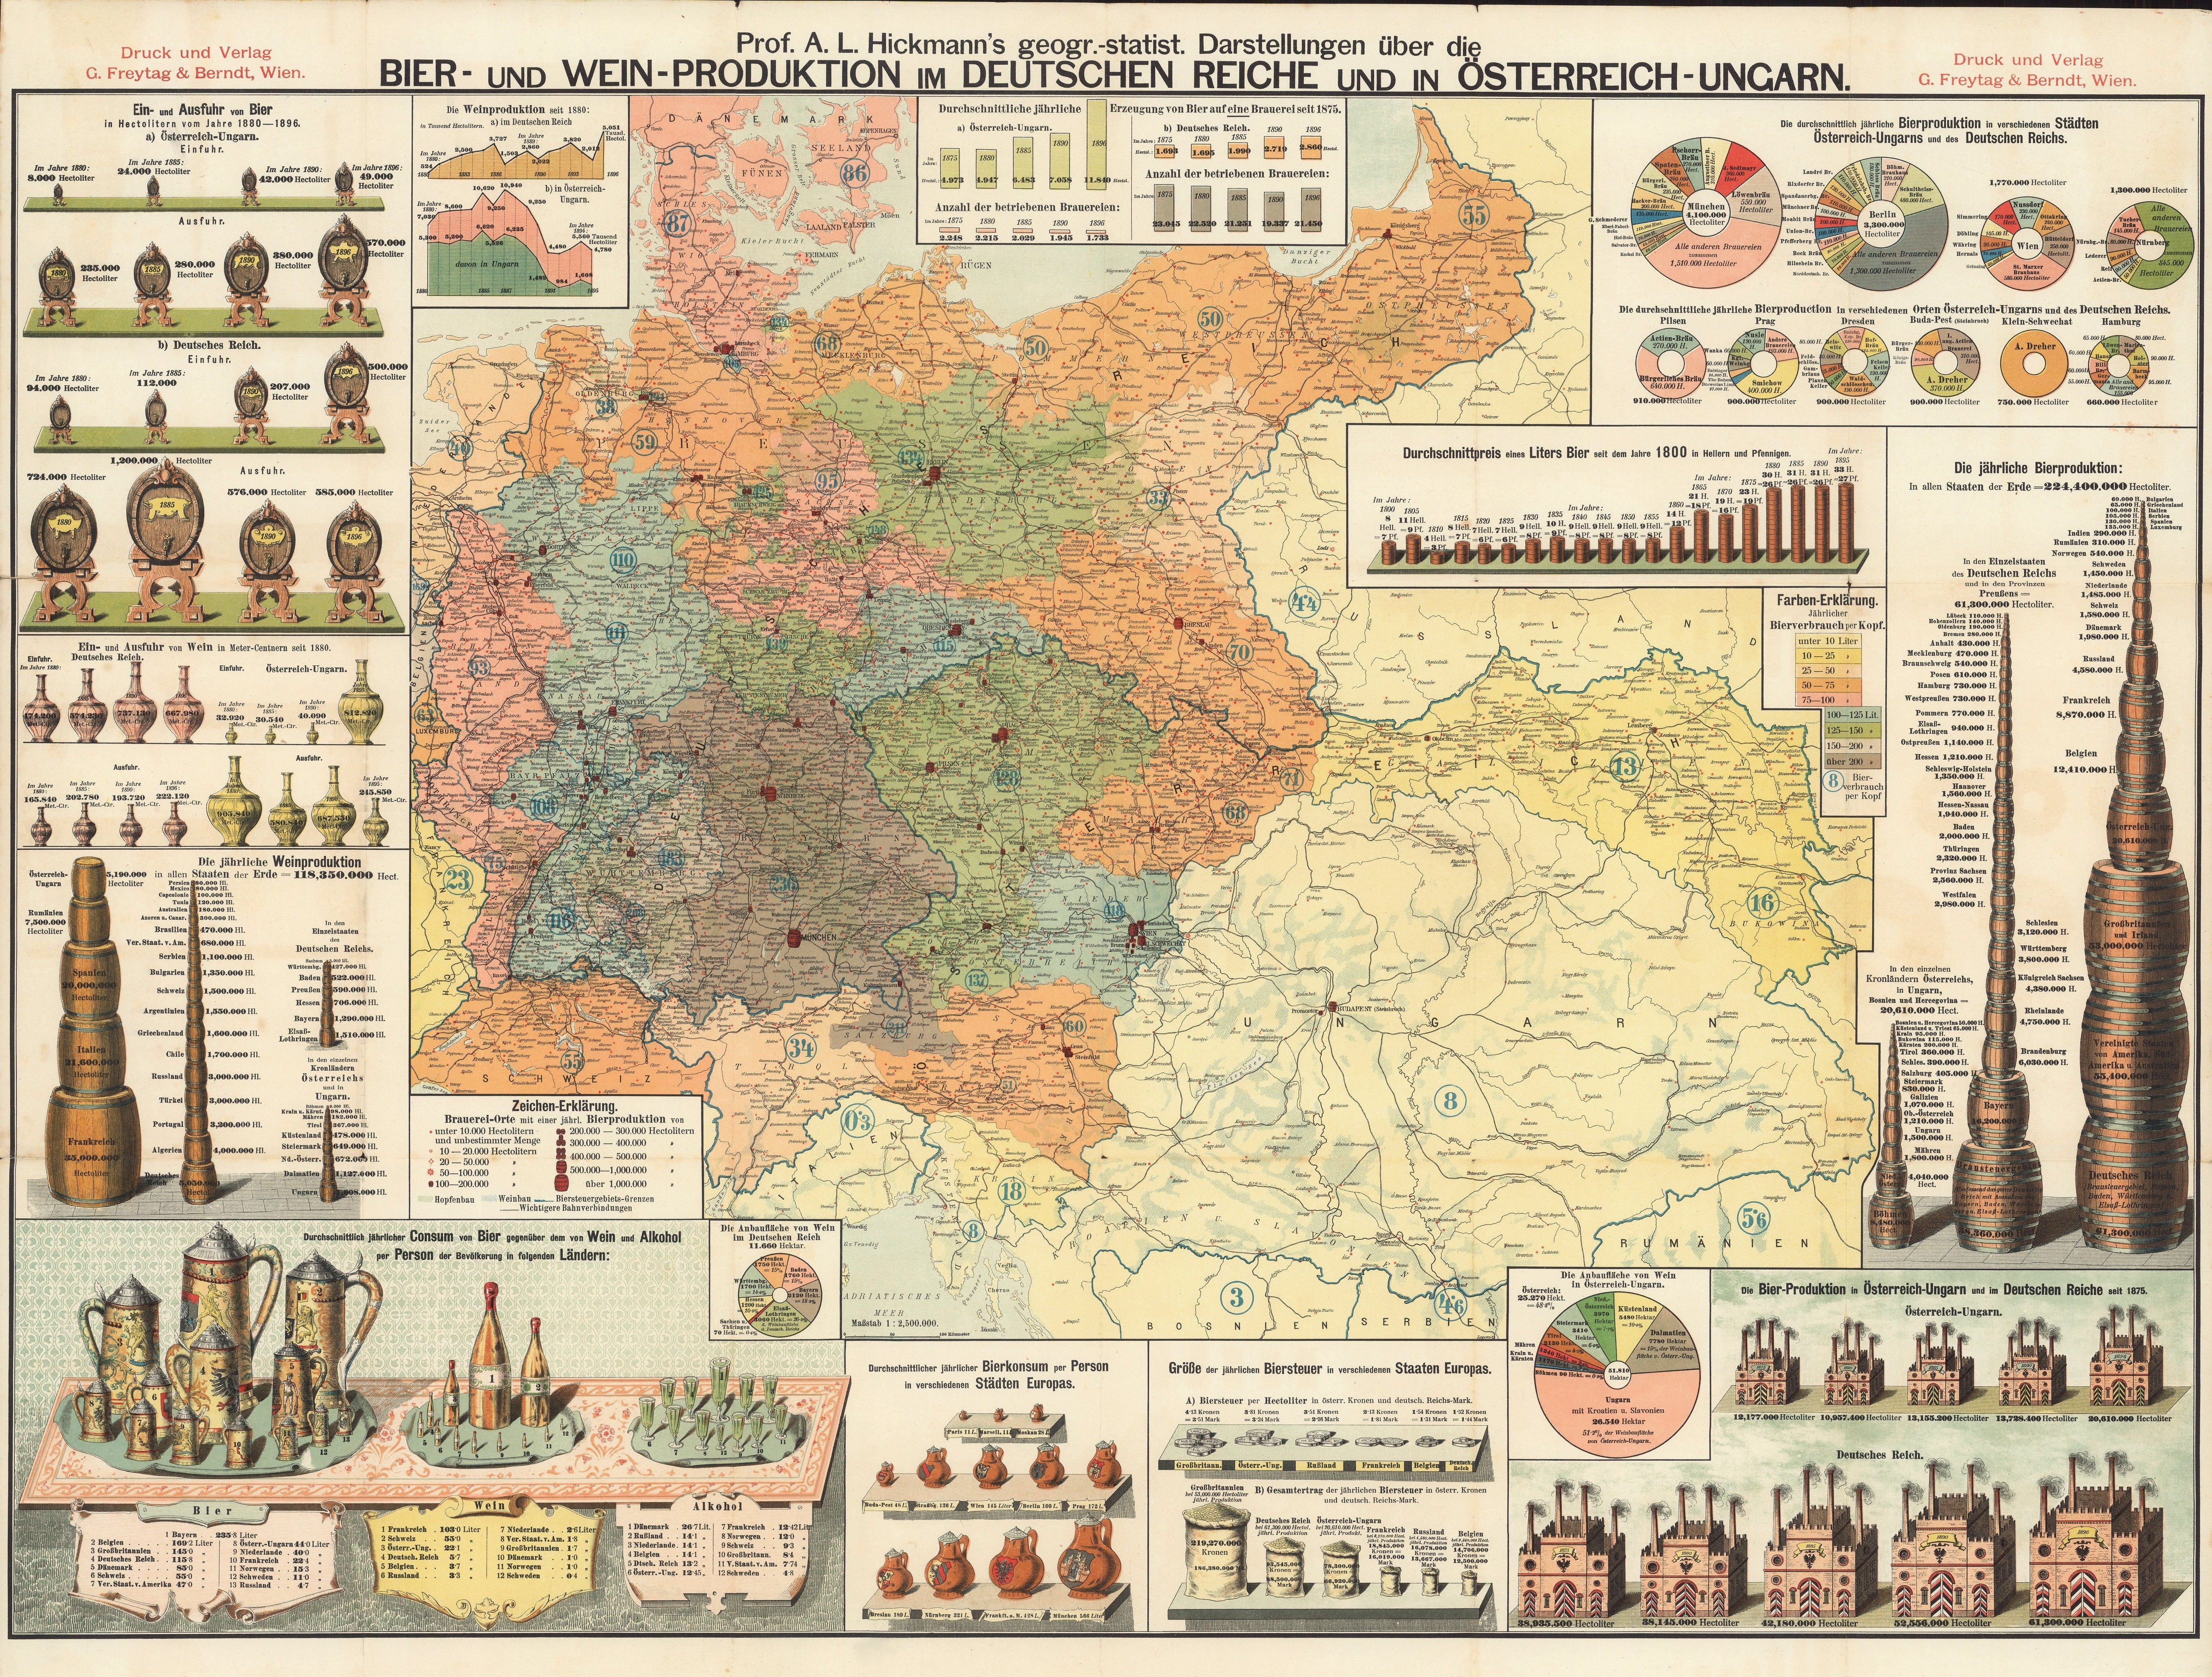
In the first 1894 edition, Hickmann used only simple bar charts and varied the sizes of the squares and circles. In this respect, he still follows in Mulhall’s footsteps. The 1897 edition—even if only on a single double-page spread—already features three 3D graphic depicting global grain, alcohol, and iron and coal production. In the same year Freytag & Berndt published a large size wall chart by Hickmann showing Germany’s and the Austro-Hungarian Empire’s wine and beer production. In this chart, Hickmann already showcases nearly the entire arsenal of 3D pictorial statistics.
In the Taschen Atlas’s 1902 edition Hickmann added four new pages of pseudo 3D diagrams and pictorial charts. The versions published after 1921 retained some of the charts from earlier editions but were supplemented with new ones.
It may have been less widely circulated, but Hickmann’s other pocket atlases, which also were published several times from 1895, focused specifically on the Austro-Hungarian Monarchy and Germany. The Geographisch-statistischer Taschen-Atlas von Österreich-Ungarn and the Geographisch-statistischer Taschen-Atlas des deutschen Reichs also made extensive use of 3D graphics. Unfortunately, Hickmann’s historical atlas of Vienna, published in 1903, has not been digitized, and I don’t have my own copy of it either. However, based on the pages available online, the stylistic difference is evident. A possible reason for this is that it was published not by Freytag & Berndt, but by Hörder.
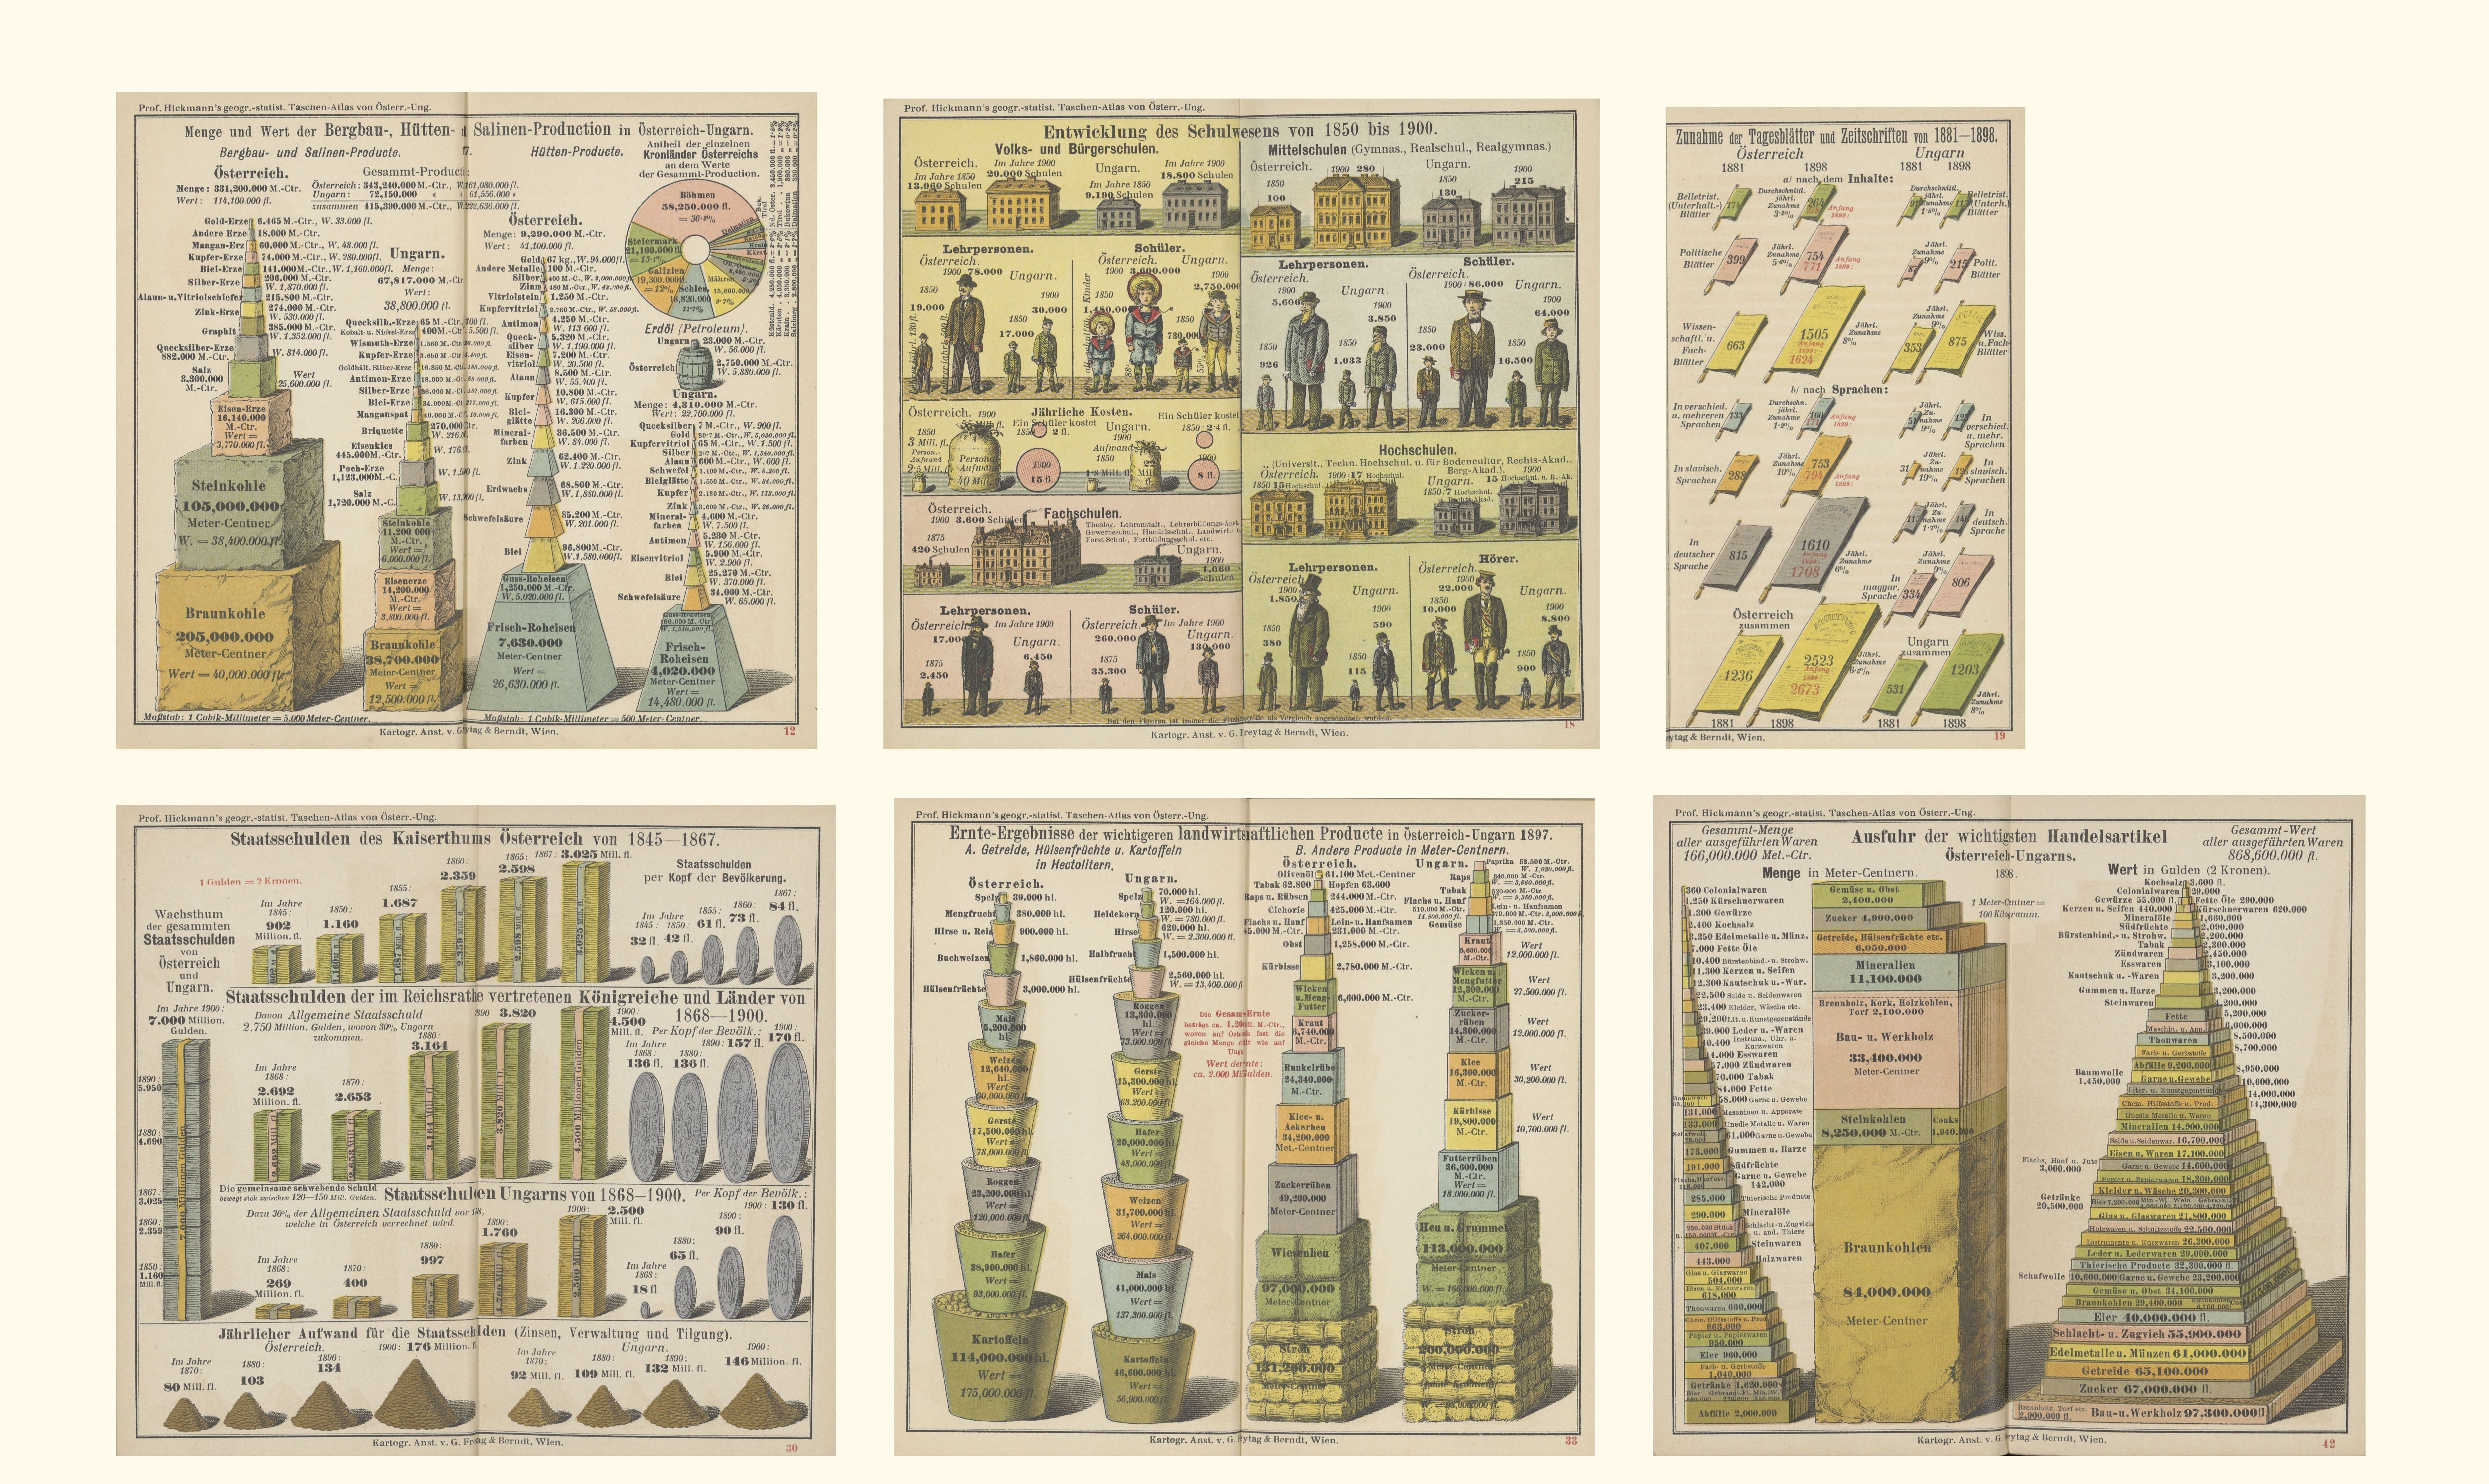
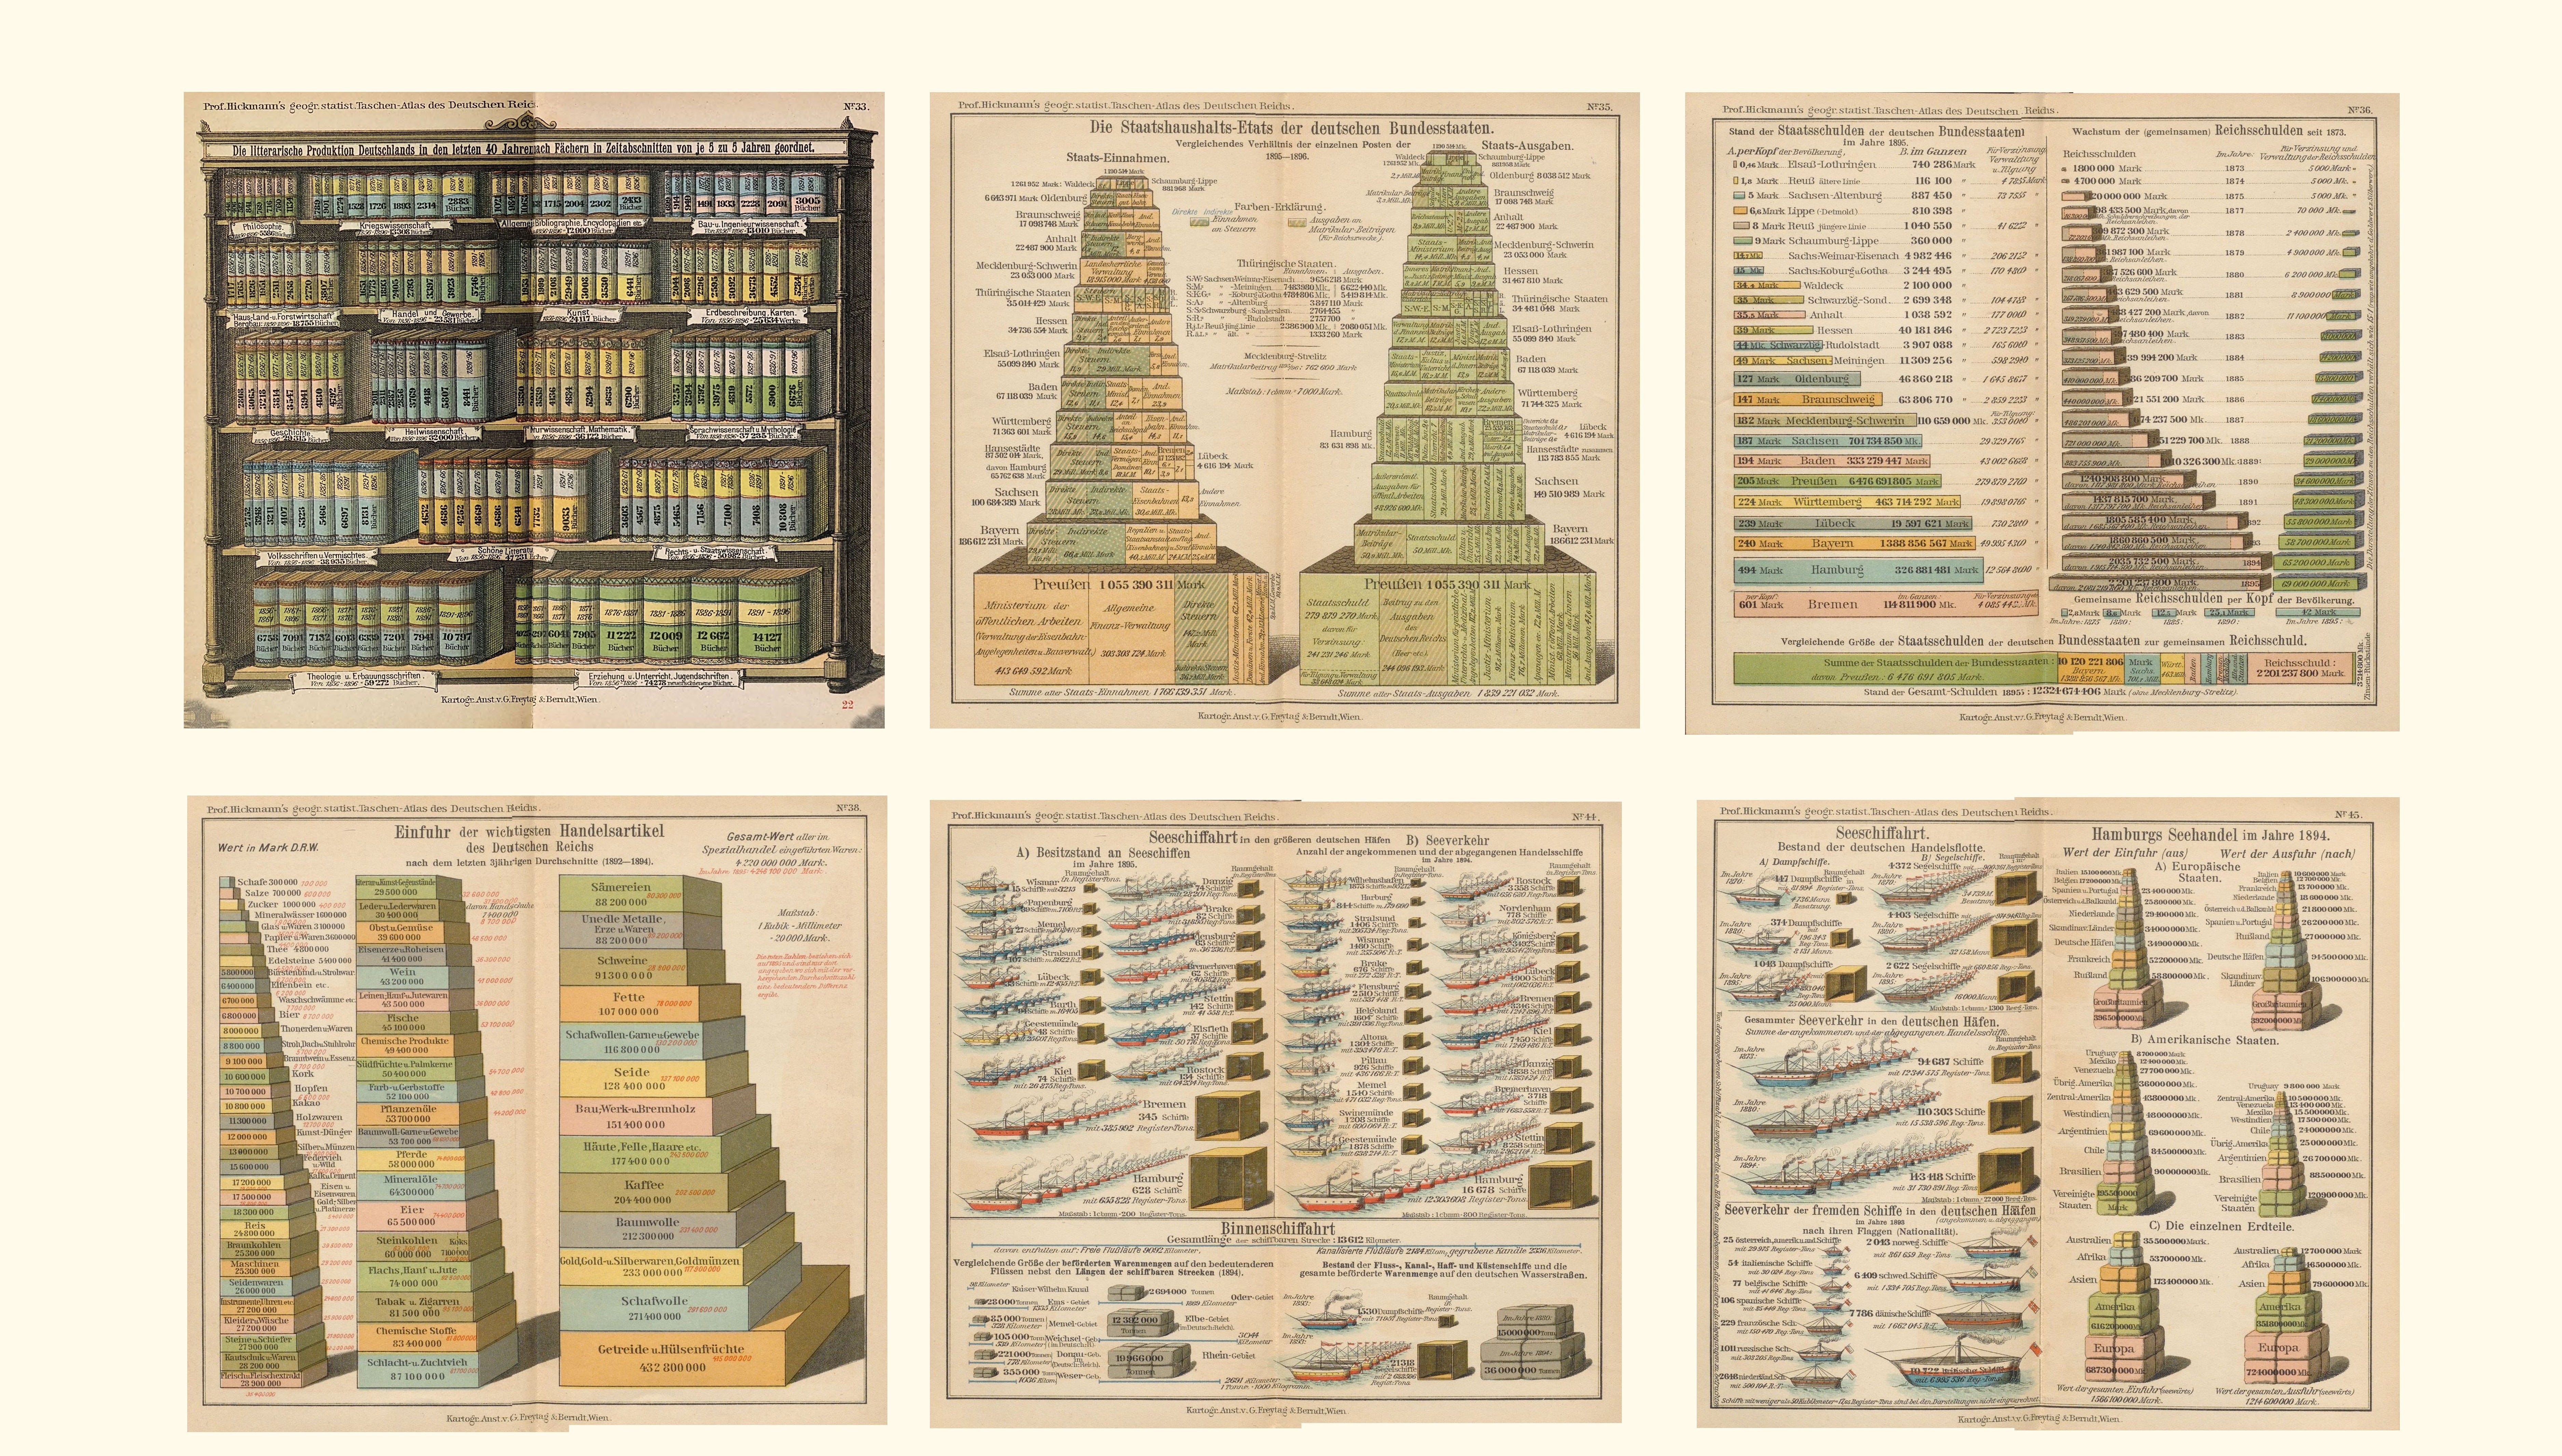
The images above provide a comprehensive overview of Hickmann’s drawing technique, his stylistic characteristics and his typical diagram types. Of course, Hickmann’s style is also deeply rooted in the tradition of 19th-century drawings and illustrations. The examples below will serve to show how Hickmann’s style, shapes and forms (coins piled on top of one another, barrels, parcels, sugar jars, ships, boxes, safes, etc.) appear in both contemporary and later statistical works, and which later became clichés.
Of course, it cannot be ruled out that someone might have developed a similar style and types of diagrams without being familiar with Hickmann’s work. Systematic research would be needed to demonstrate even more convincing way Hickmann’s direct influence. In the case of Russia, Vladimir Laptev writes about Hickmann’s influence in his monograph Russian Infography, and in his article in Nightingale.
Most of my examples are taken from albums produced specifically for representational or promotional purposes, but these same types of drawings can be found in hundreds of articles, publications, leaflets, postcards, posters and exhibition panels. It is likely that, in the early 20th century, the general public encountered statistical data primarily through such illustrations.
Romania
Carte statistique agricole
by Nicolae Cucu Starostescu
Bucharest: Service Central Statistique, 1900
Source: Wikimedia Commons

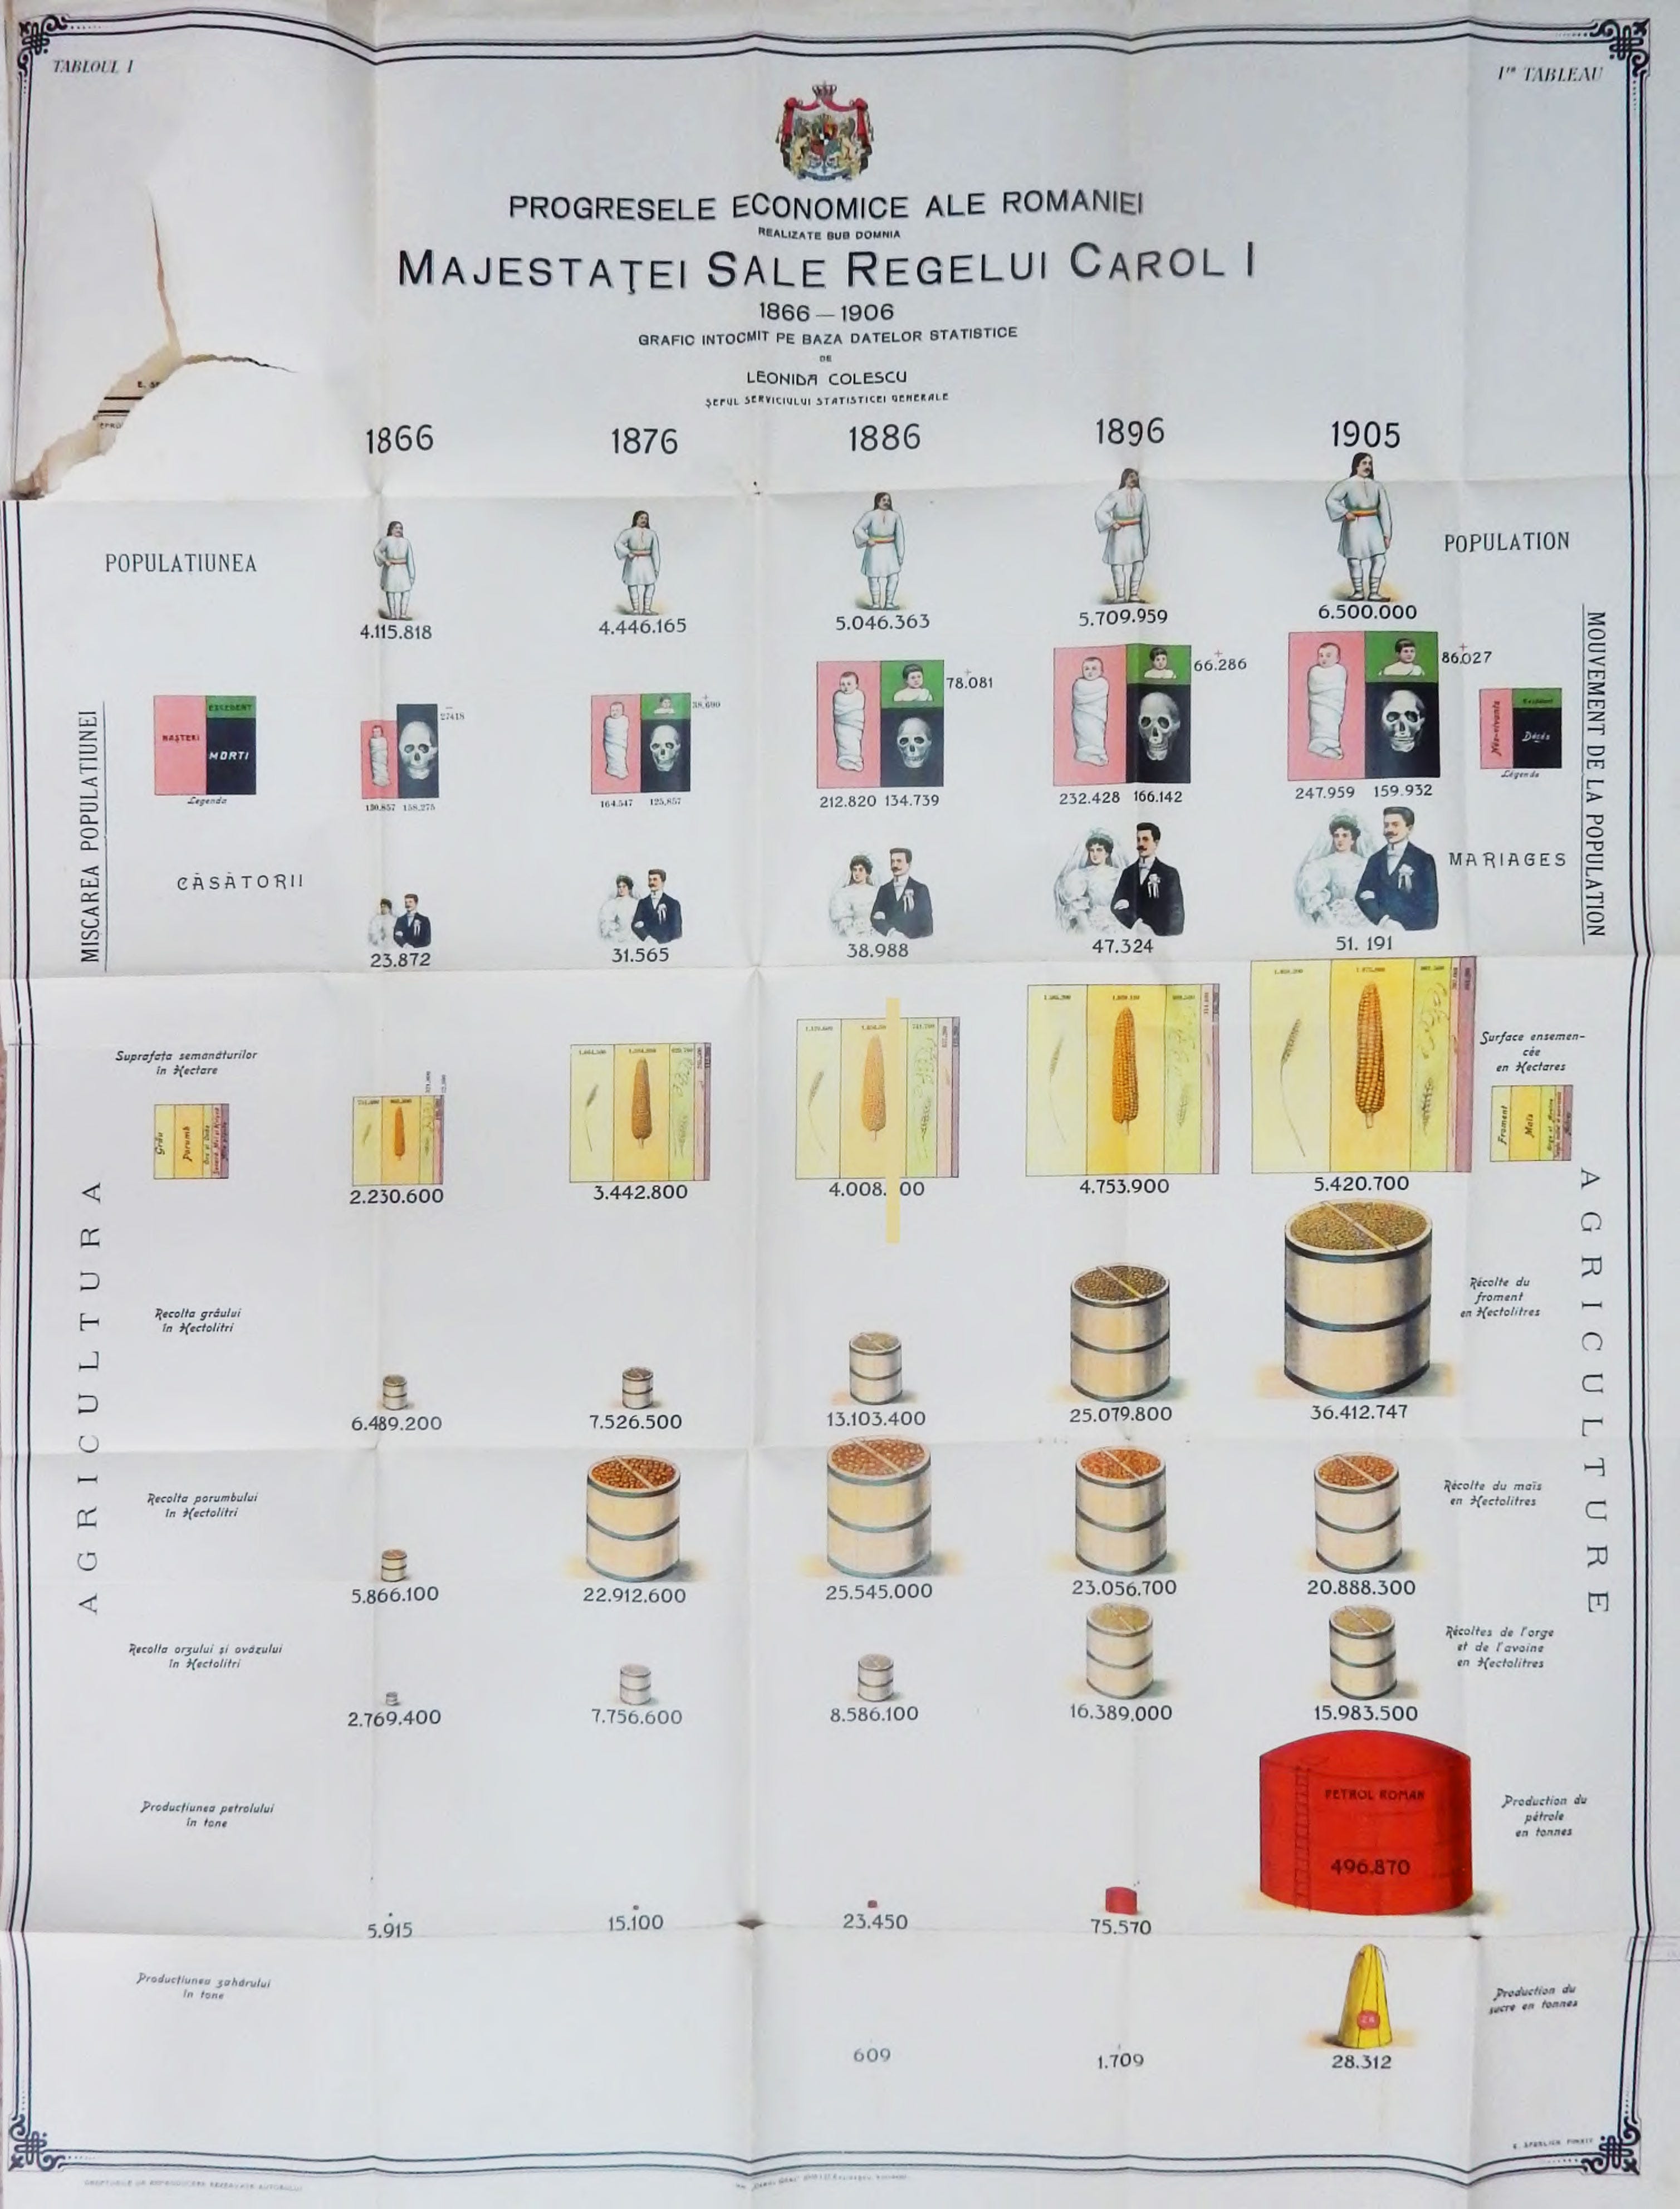
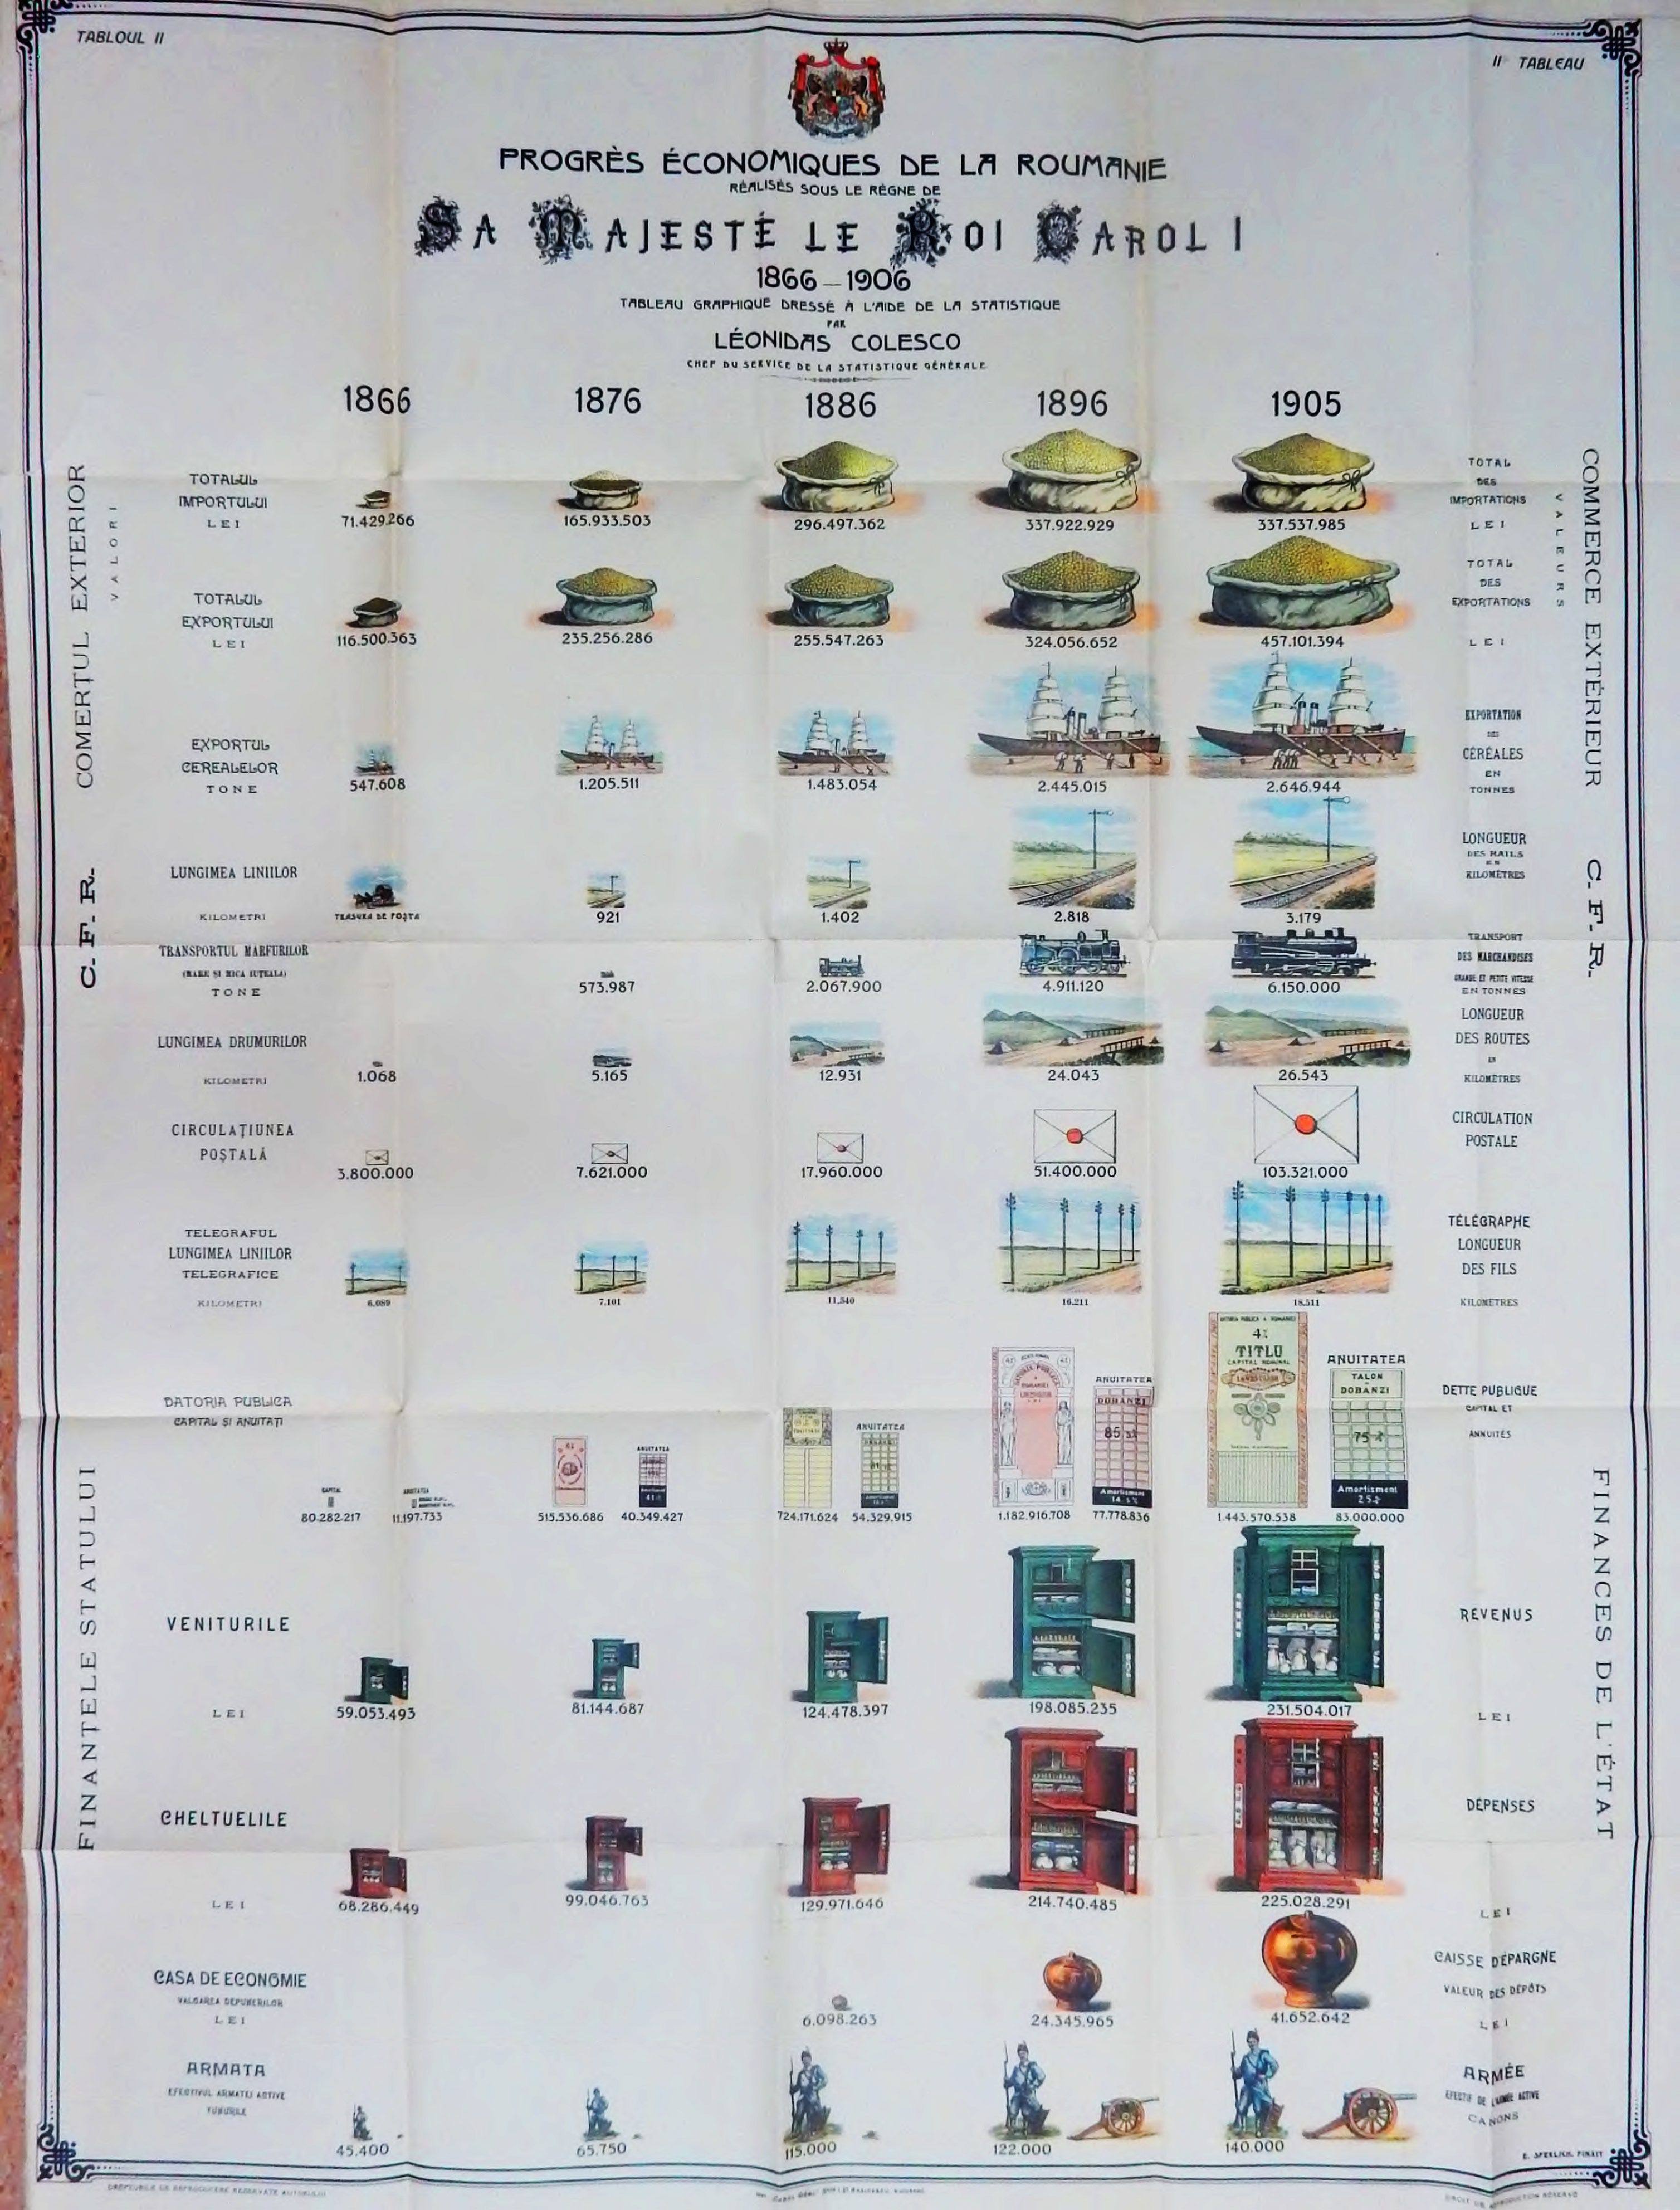
Progresele economice ale României, îndeplinite sub domnia Majestății Sale Regelui Carol I, 1866-1906
by Leonida Colescu
Bucharest: Carel Göbl, 1907
Source: Mihail Eminescu Central University Library Iasi
Russia
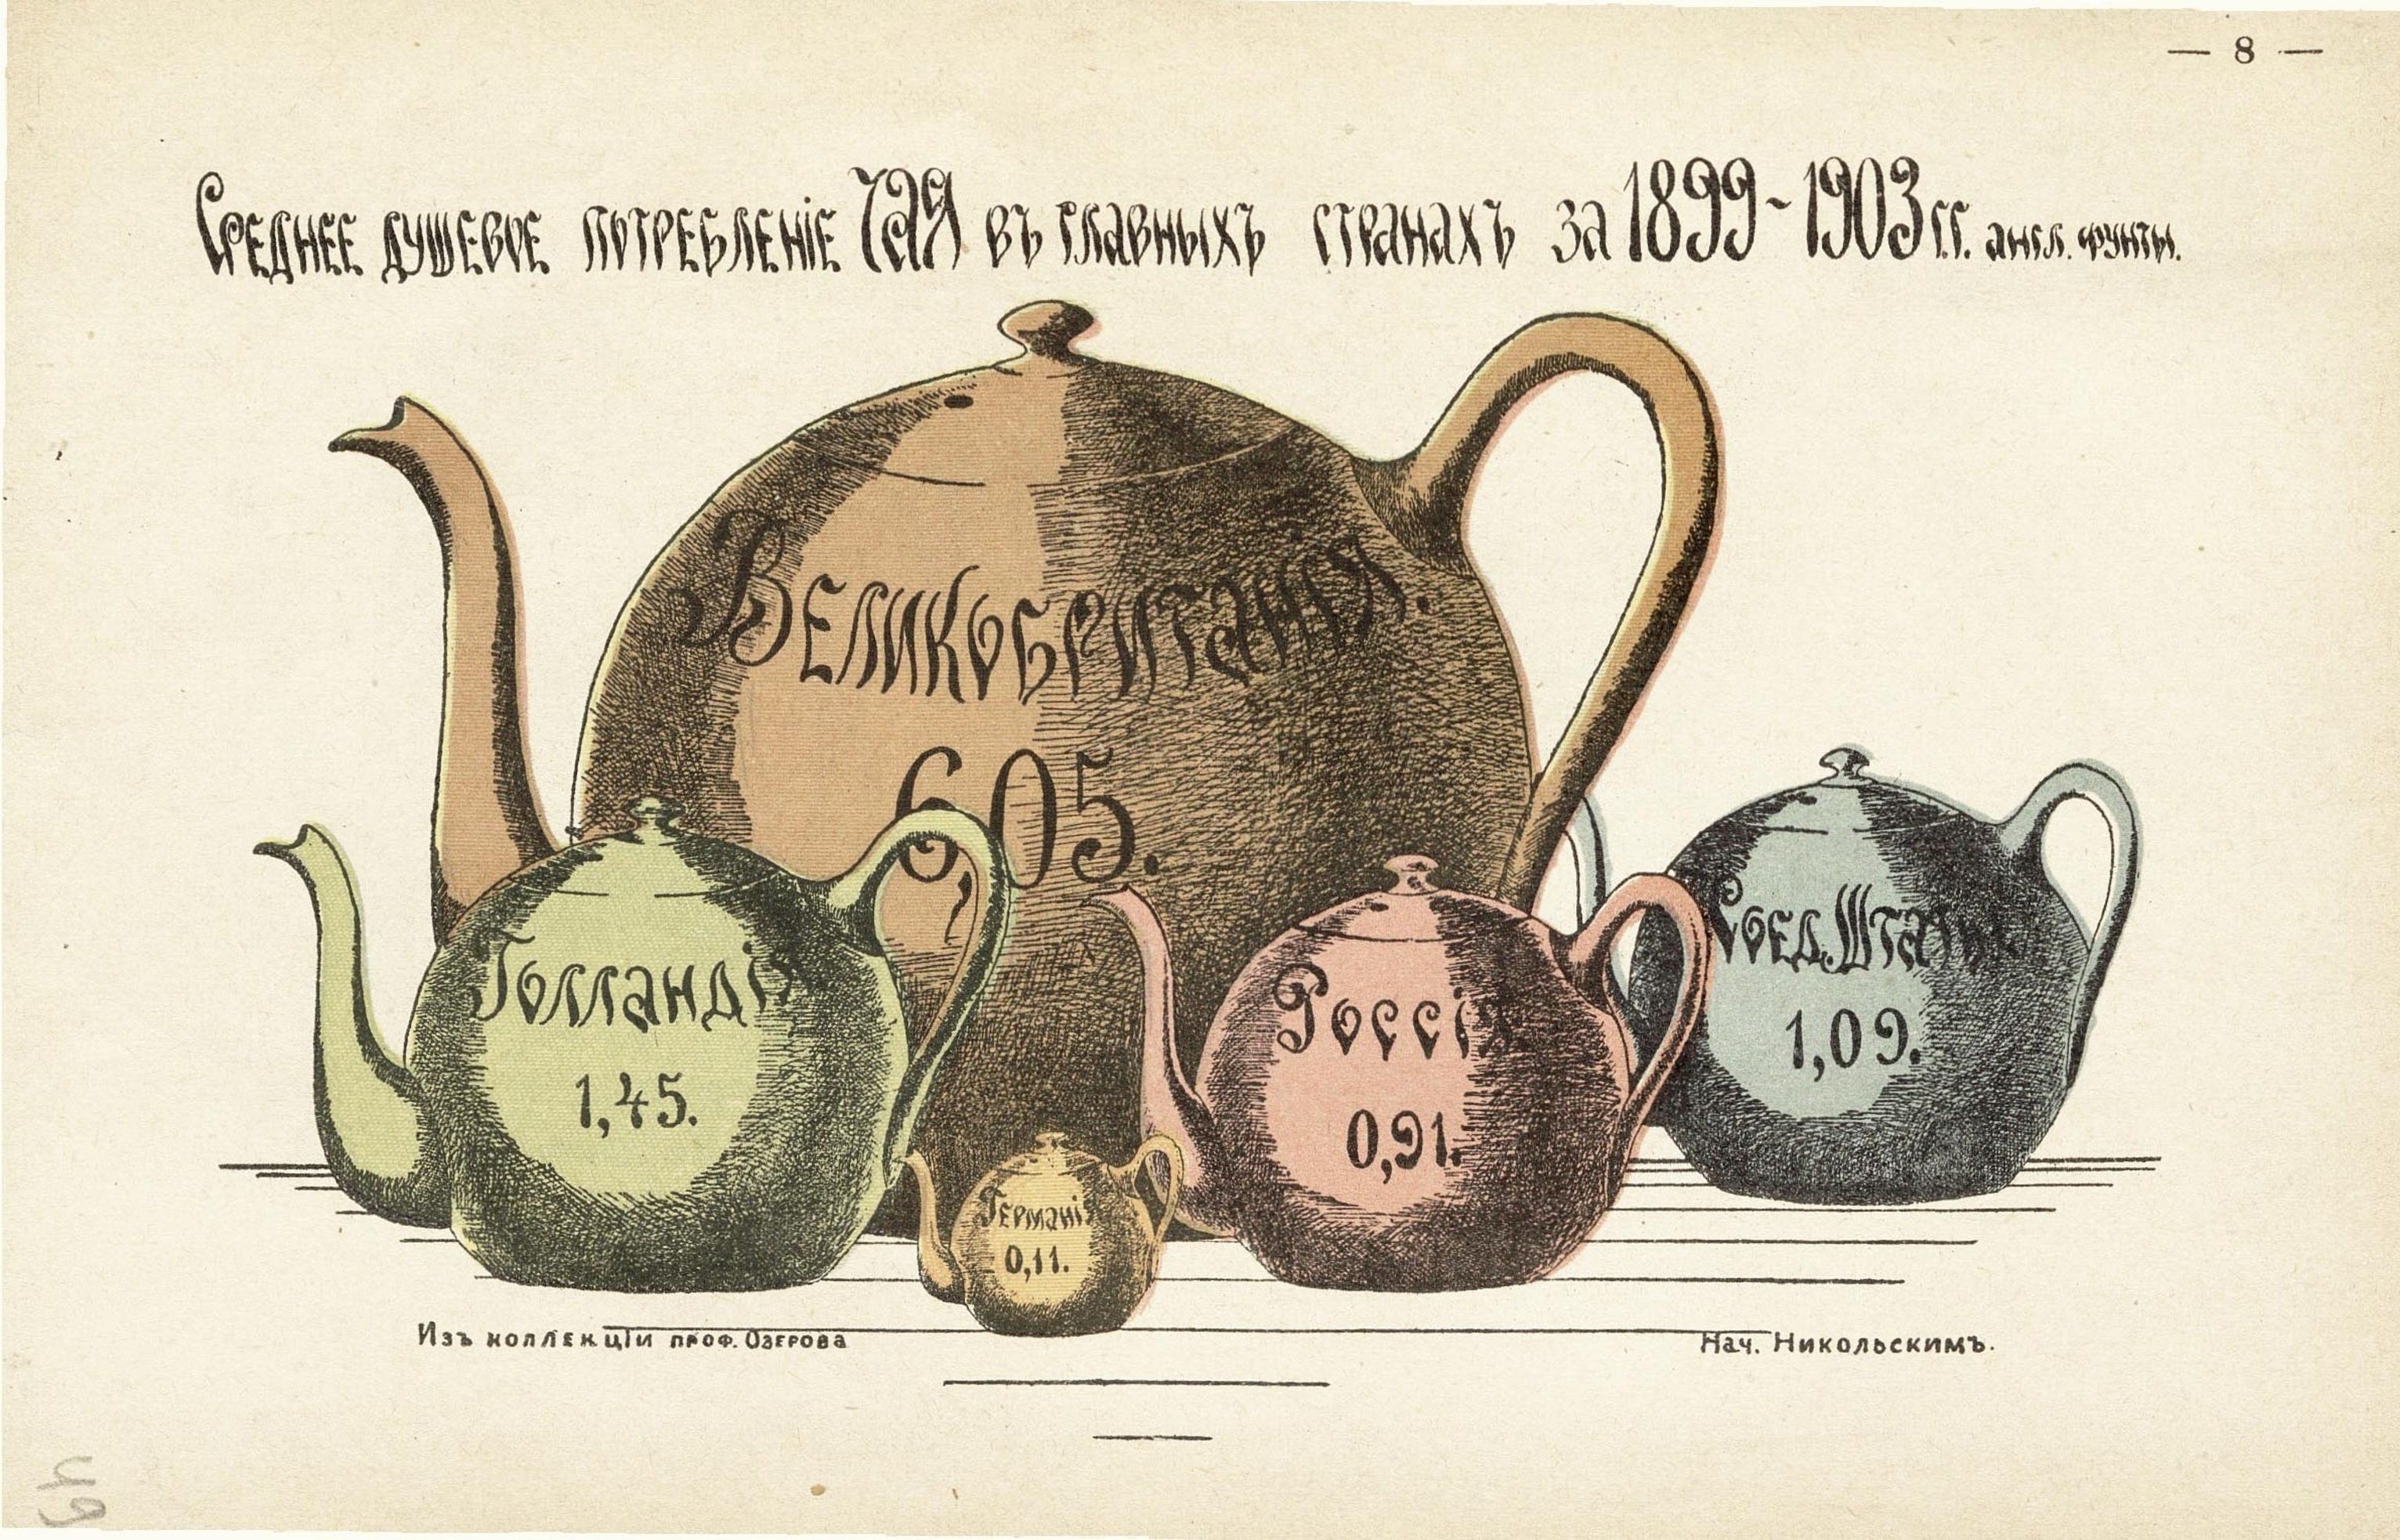
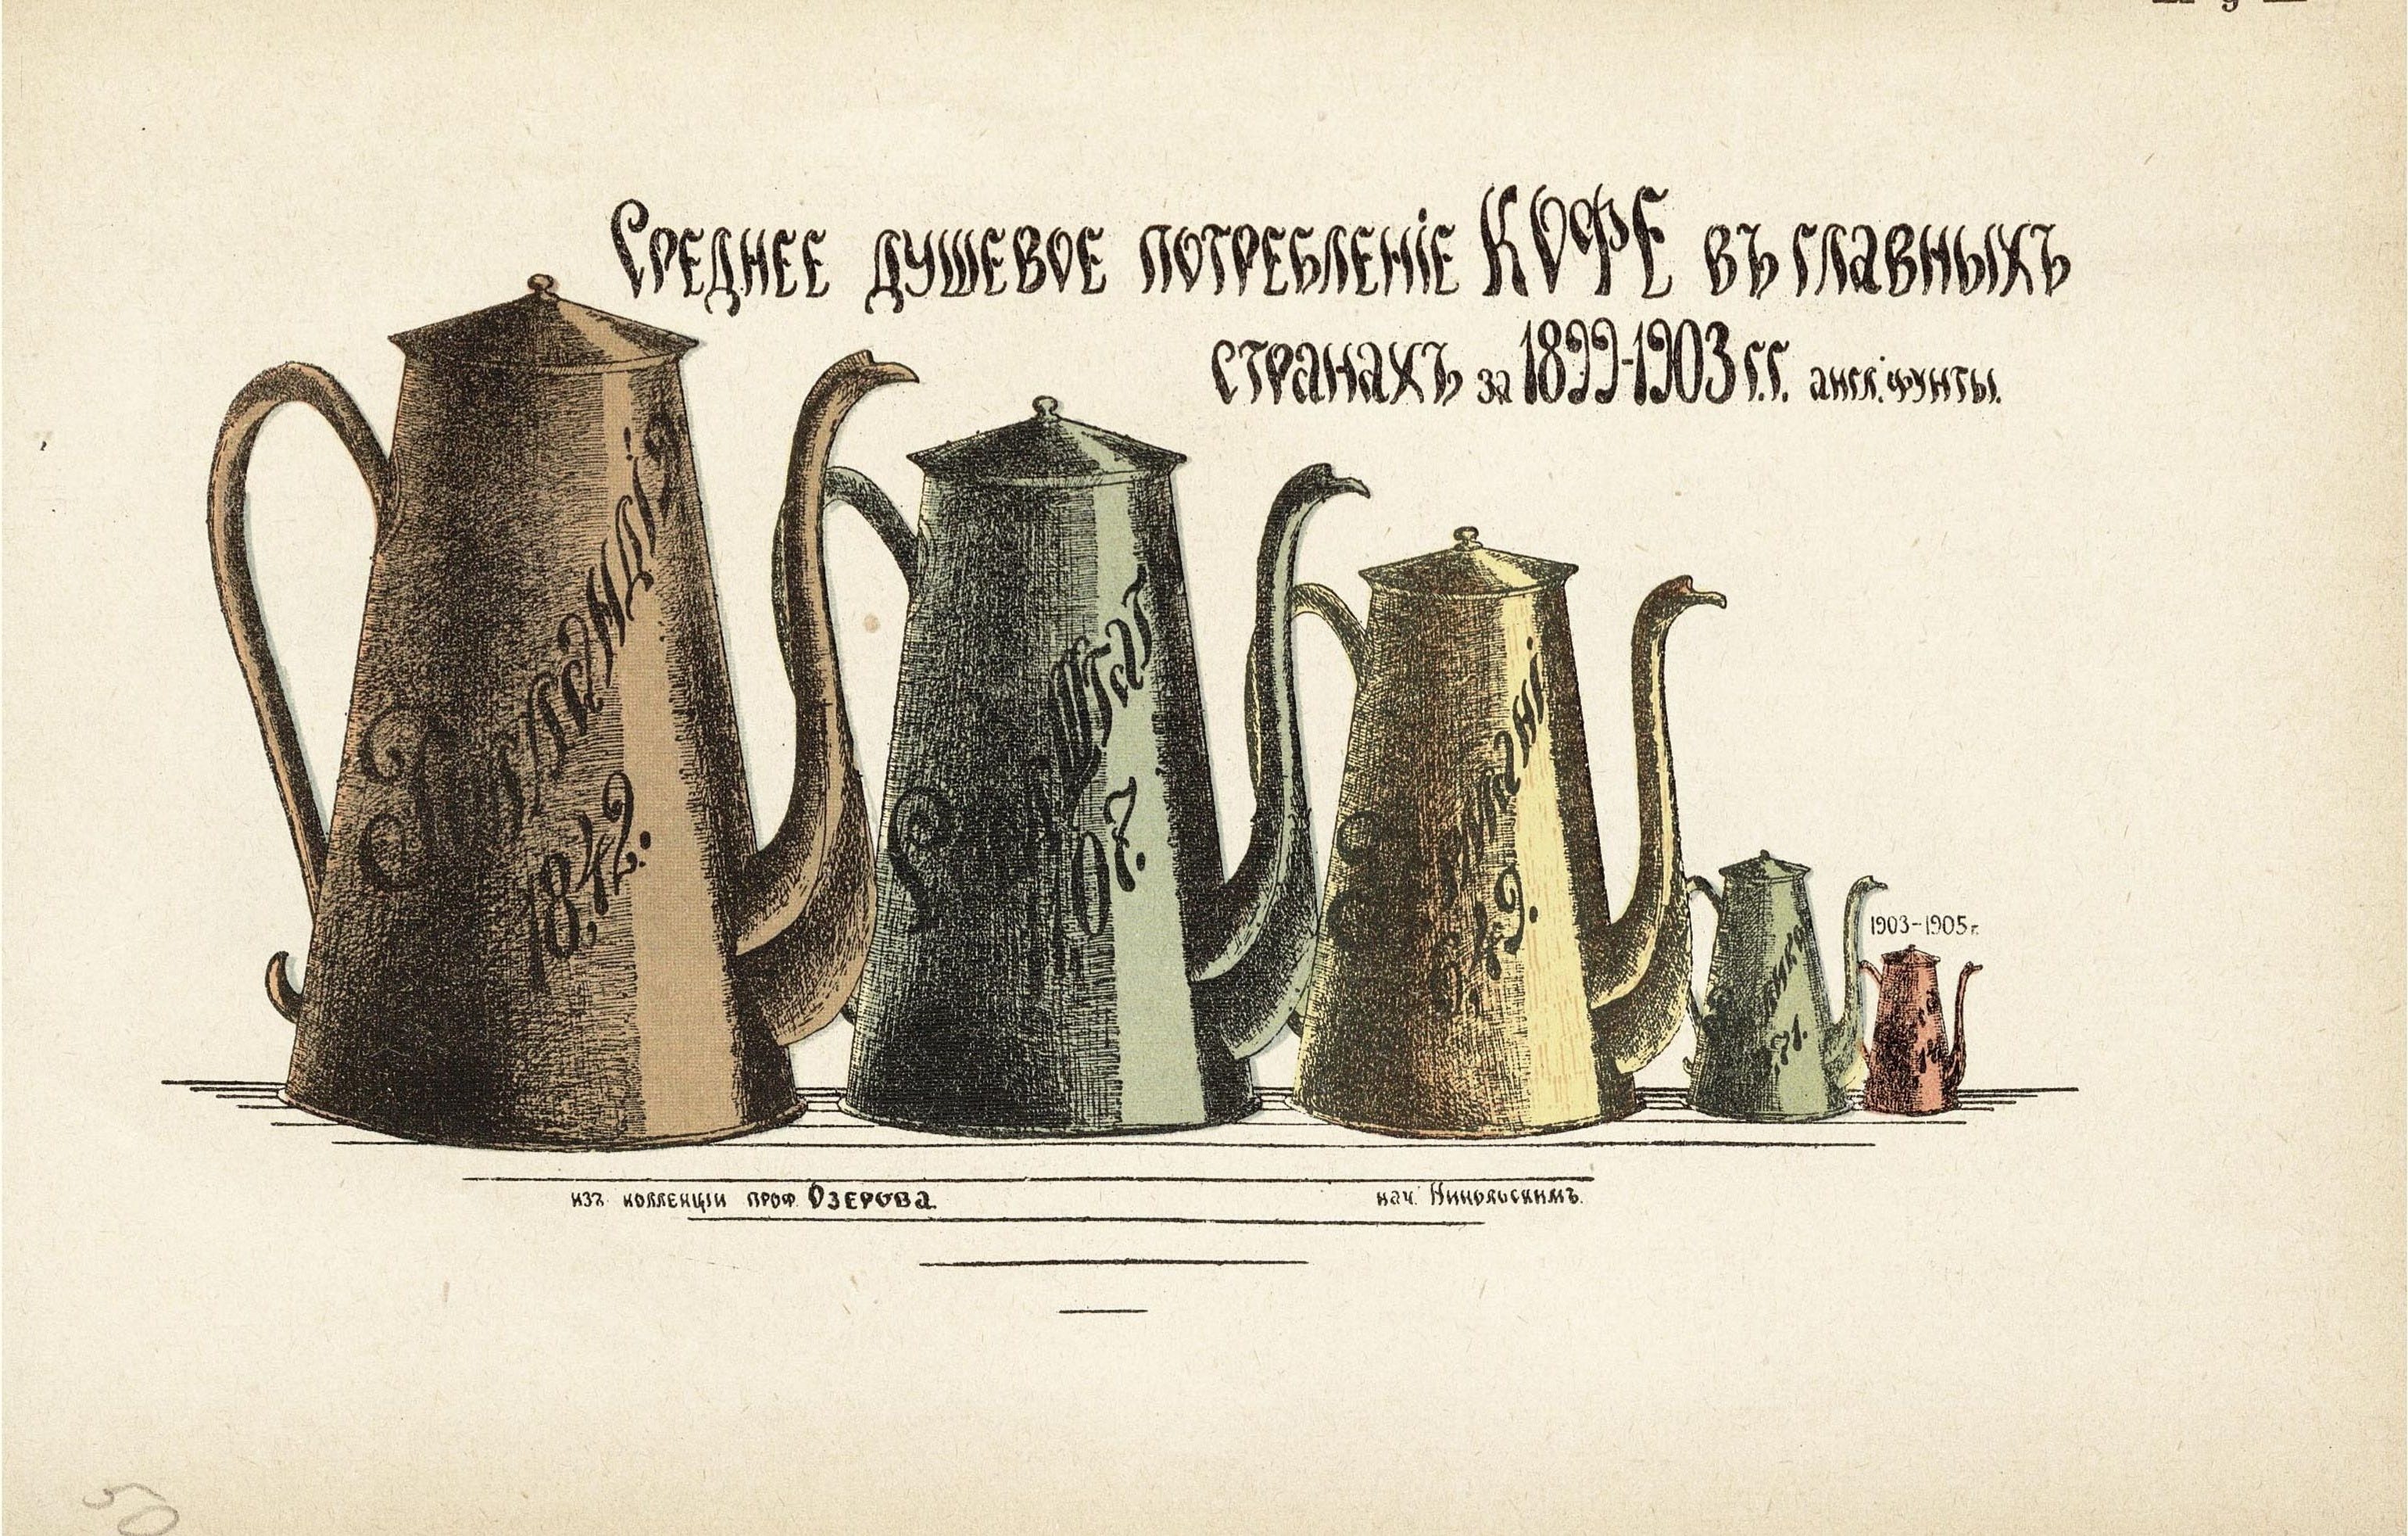
Atlas of Charts on Economic Issues / vol. 8 - Russia in the World Family
by Ivan Khristoforovich Ozerov
Moscow: Printing House of the I.D. Sytin Partnership, 1909
Source: Russian State Public History Library
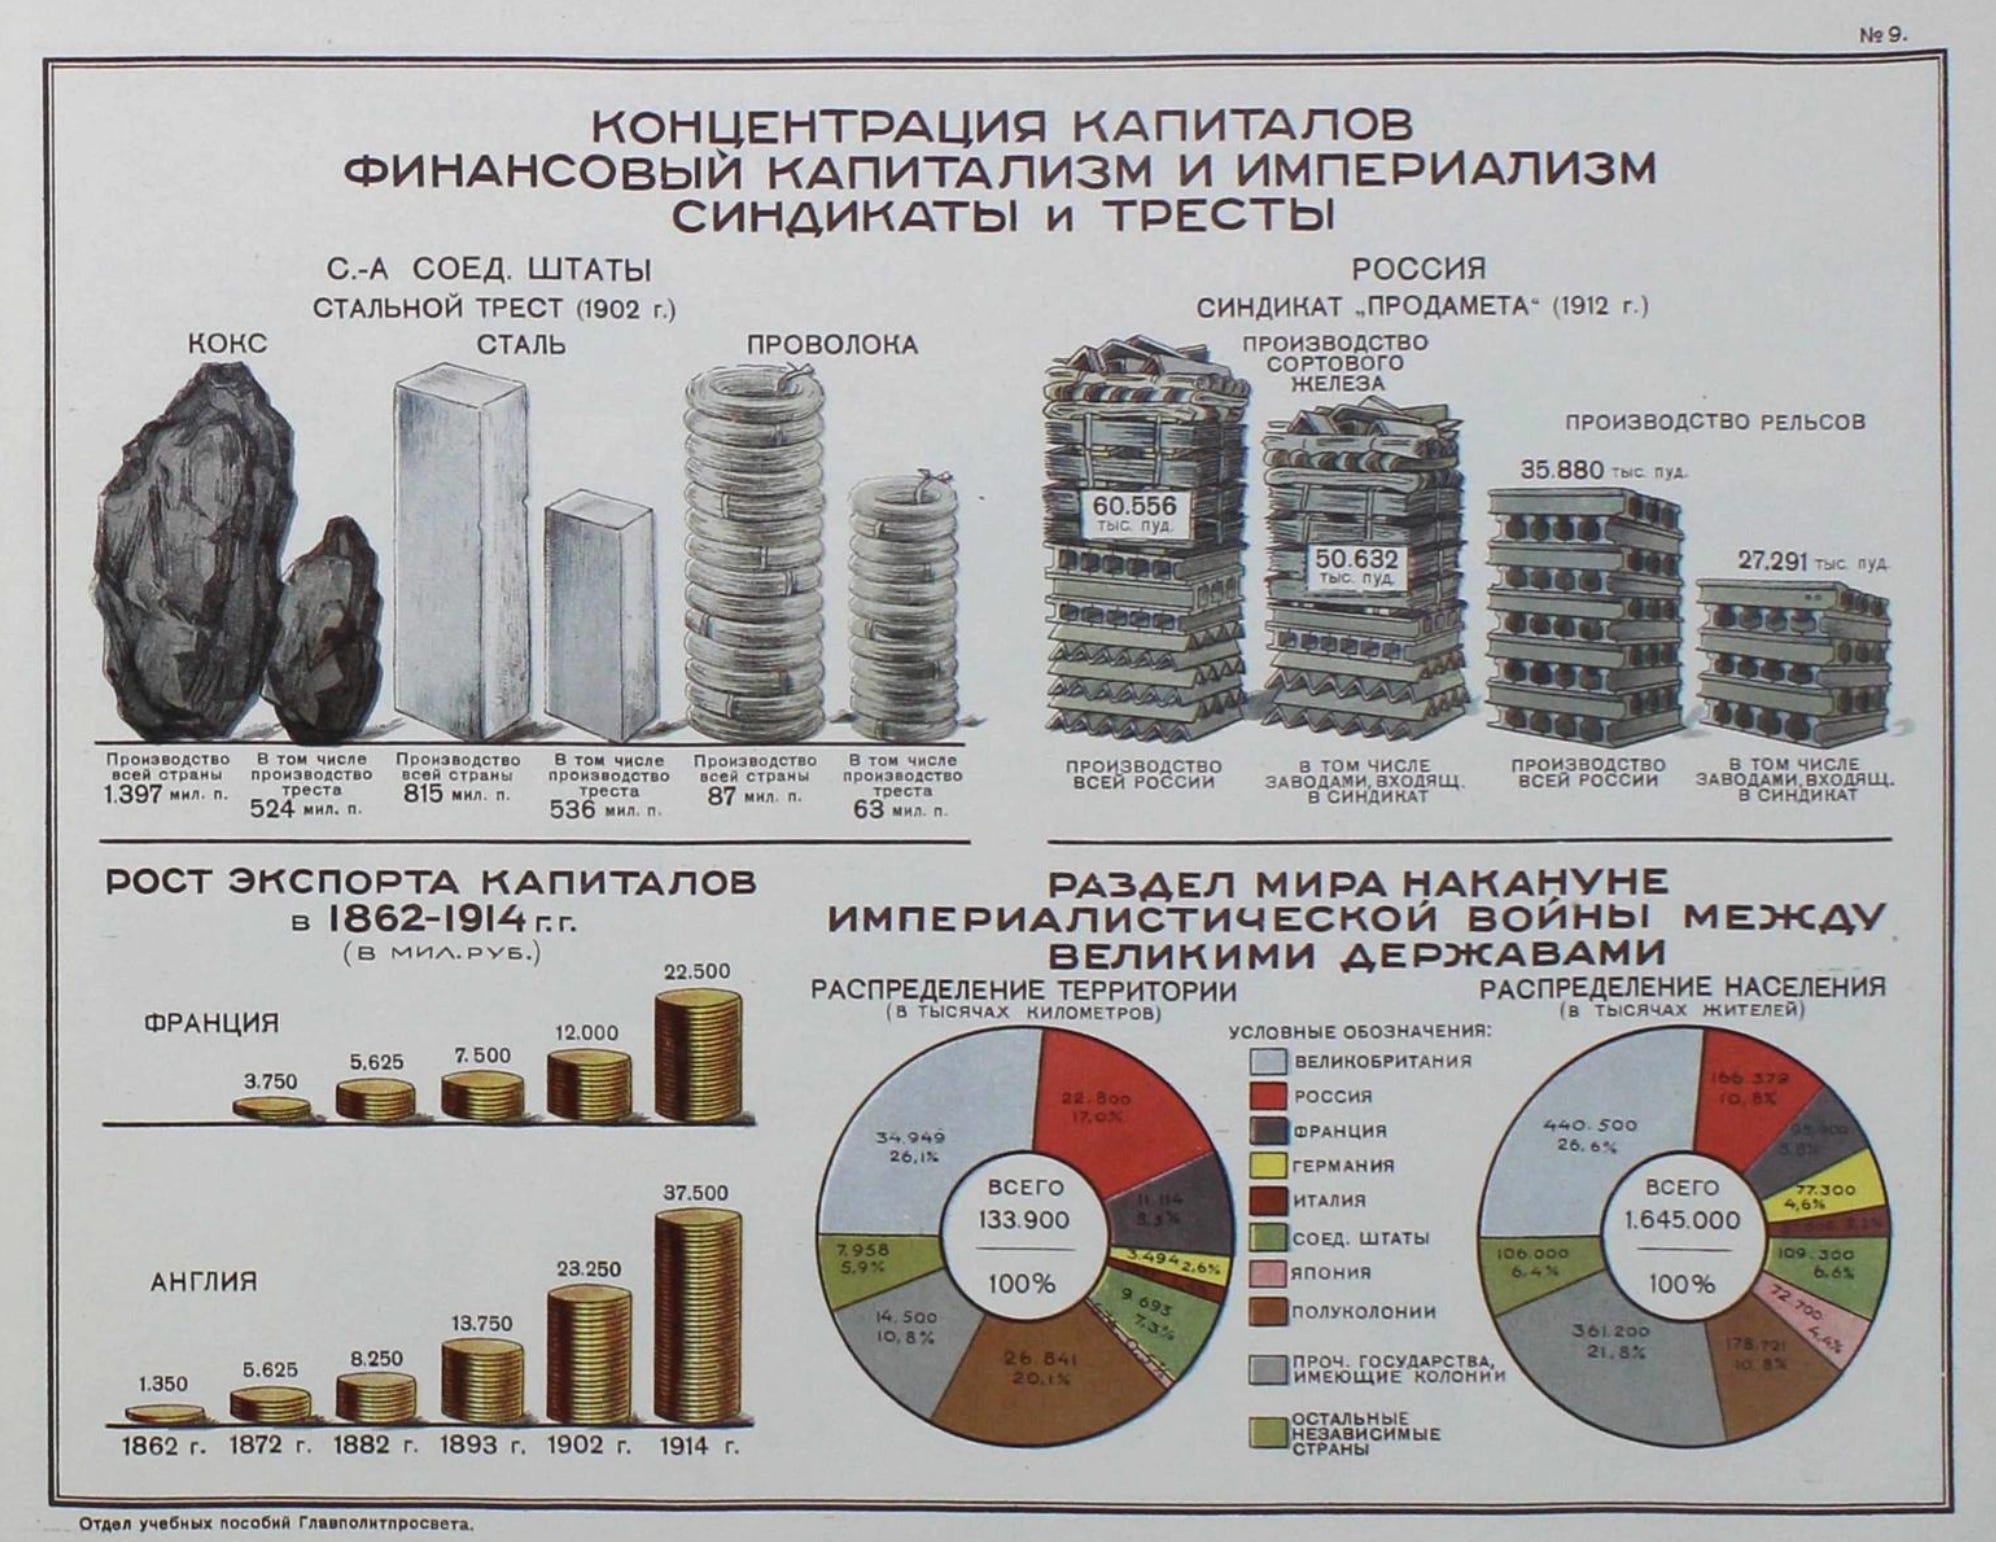
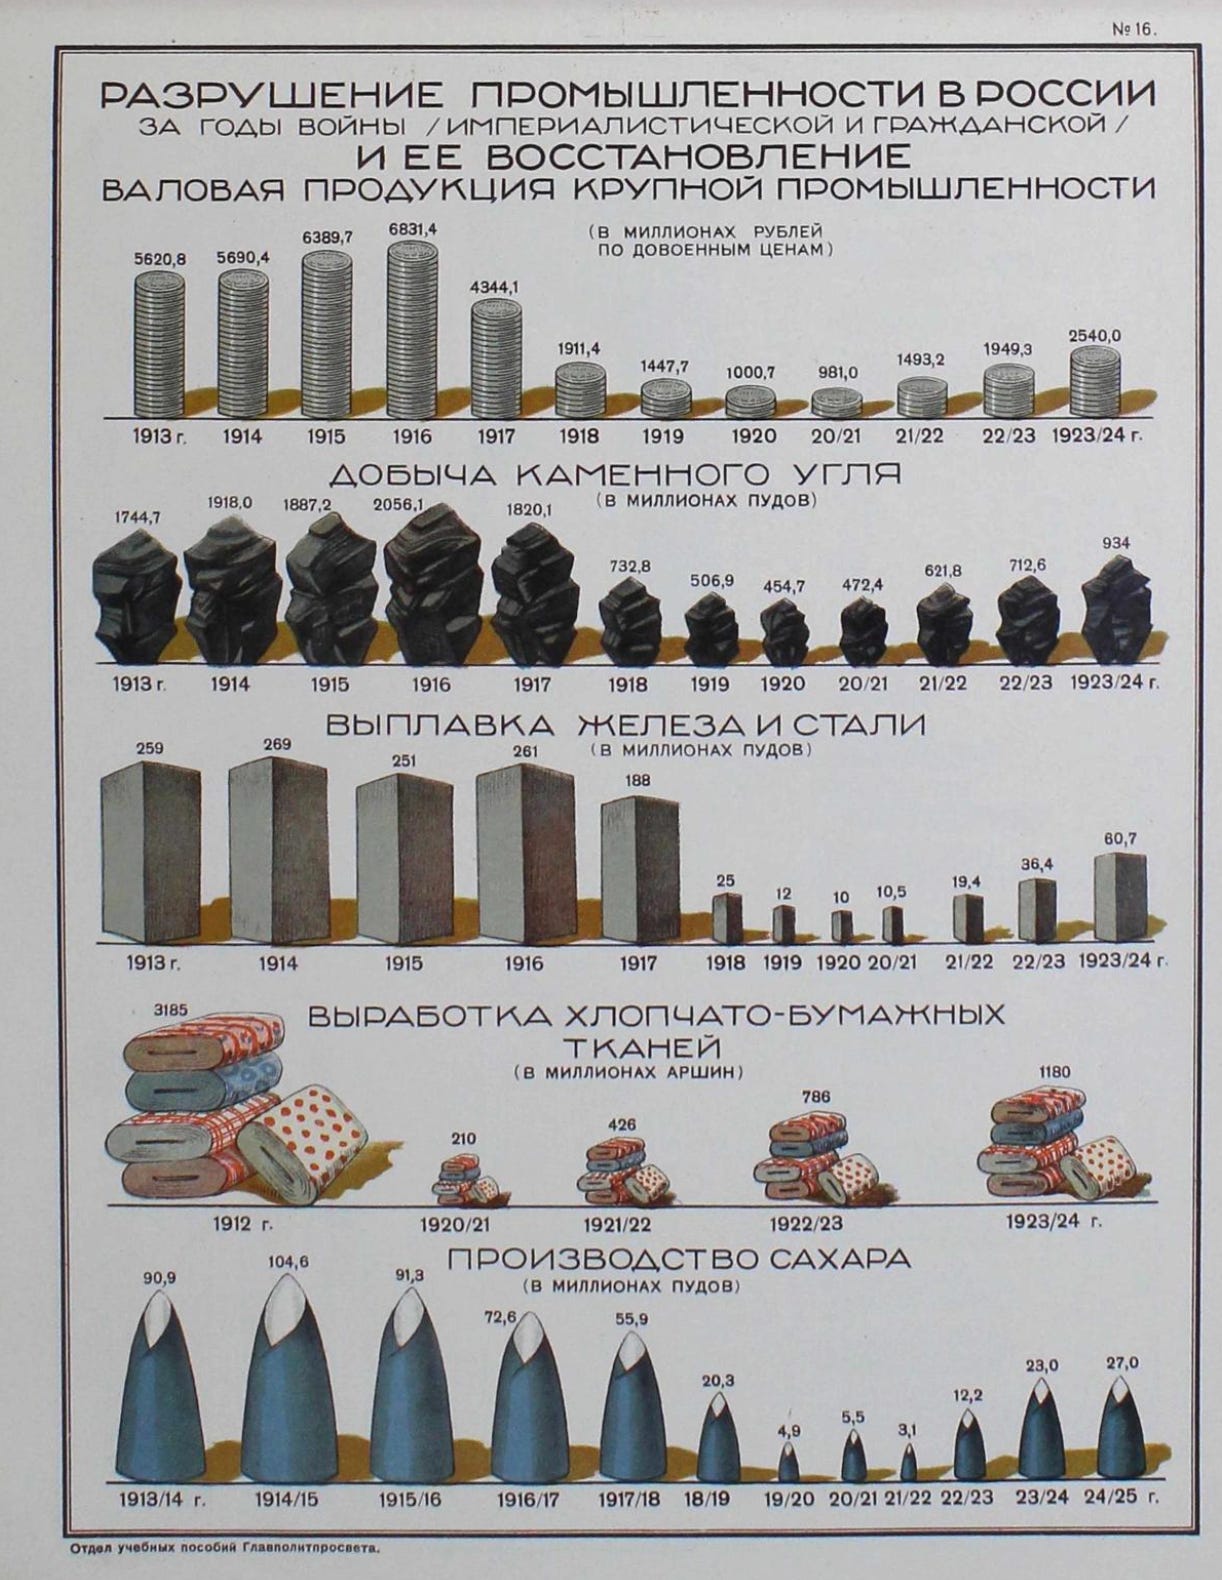
Atlas of Diagrams on Economic and Political Questions
Explanatory Text by V. Yudovsky
Department of Educational Aids of the Main Political Education Admin.
State Publishing House, 1925
Source: Russian State Library
Estonia
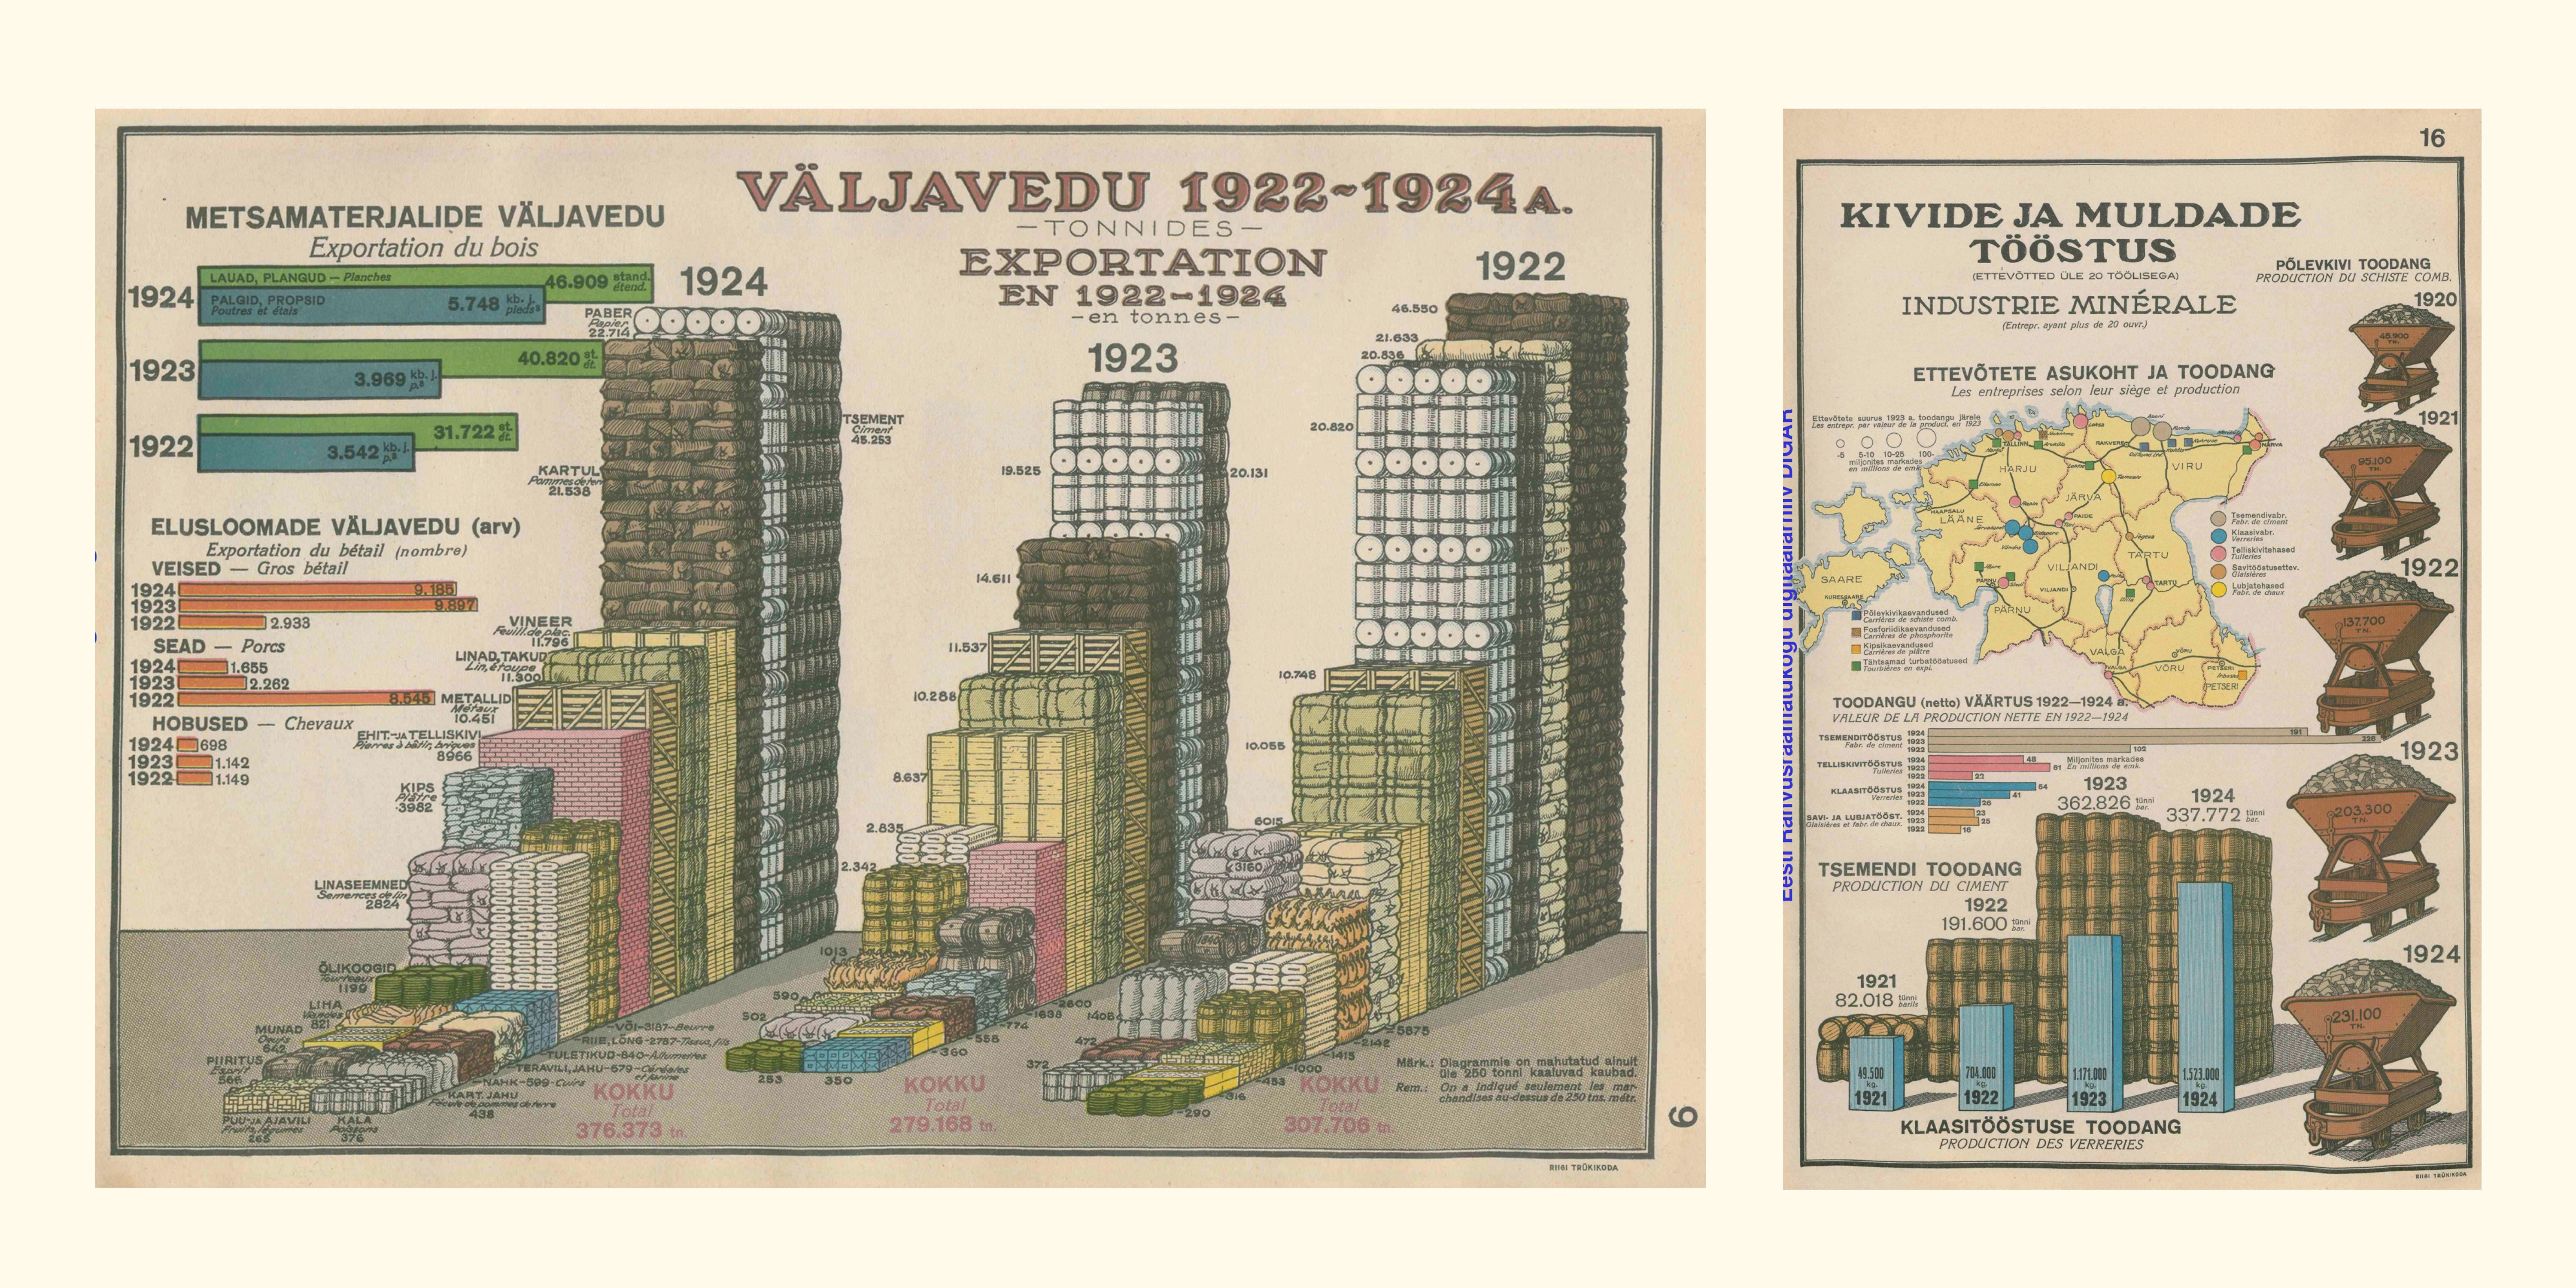
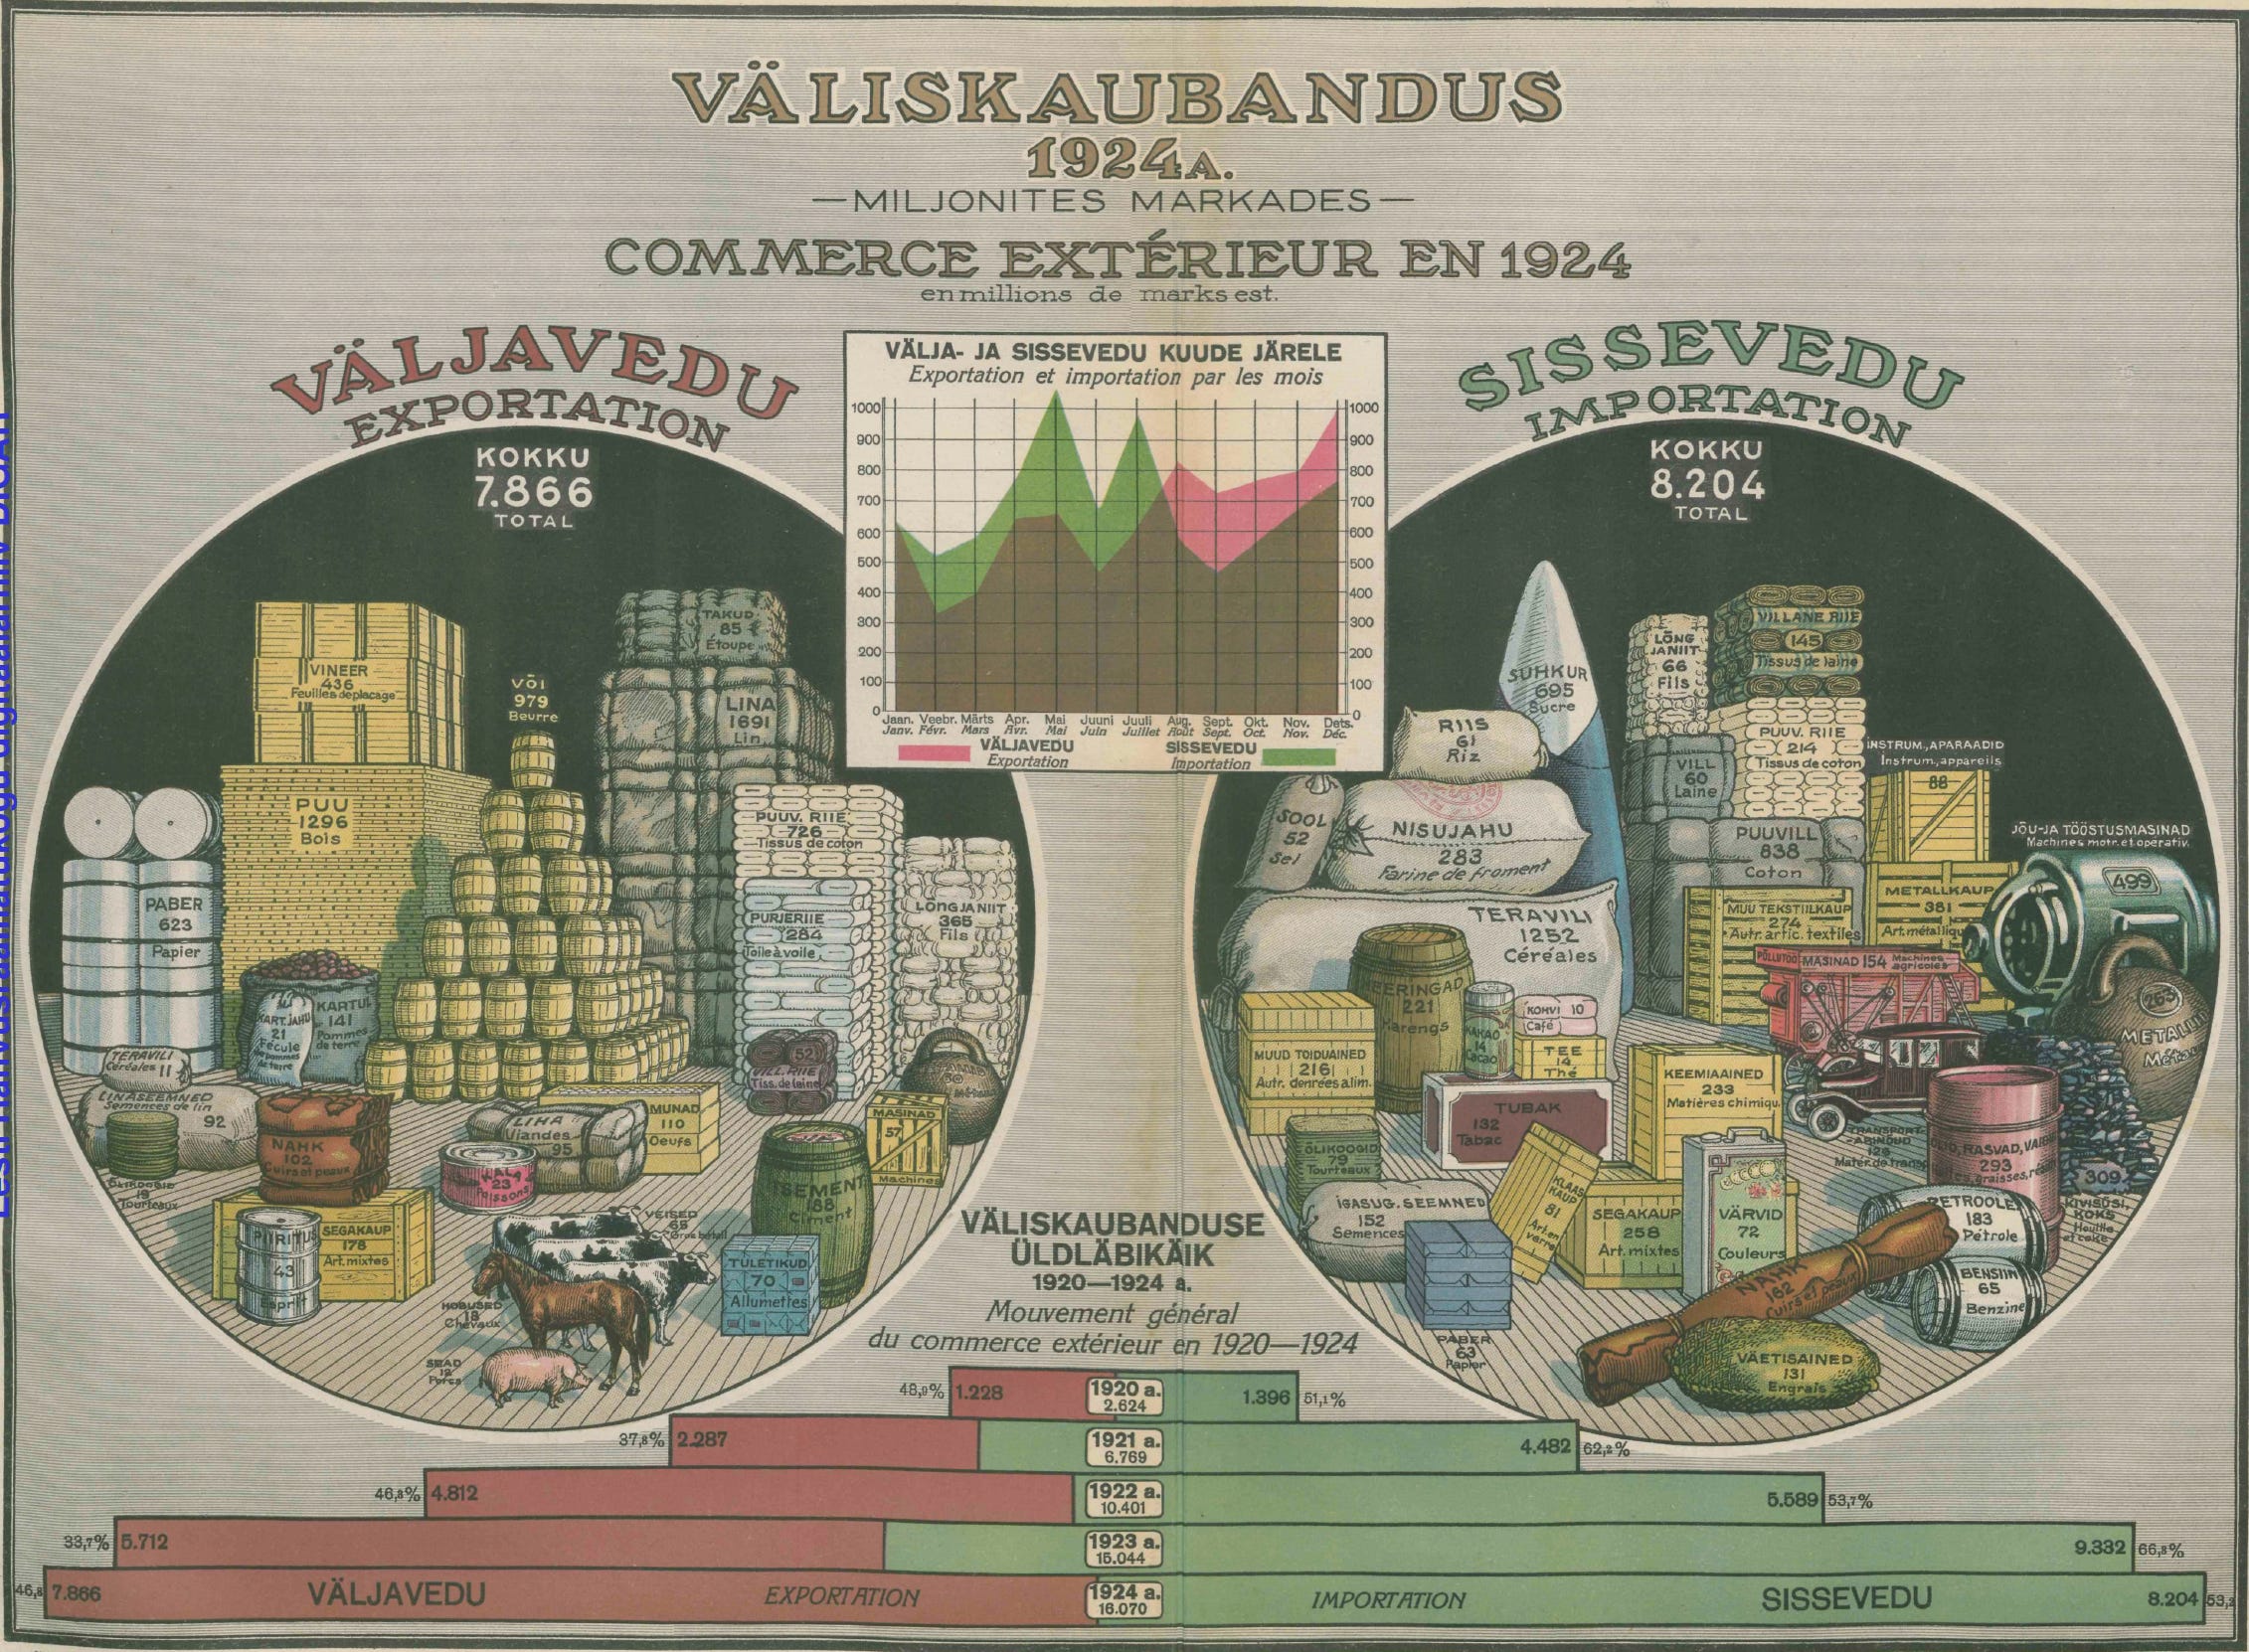
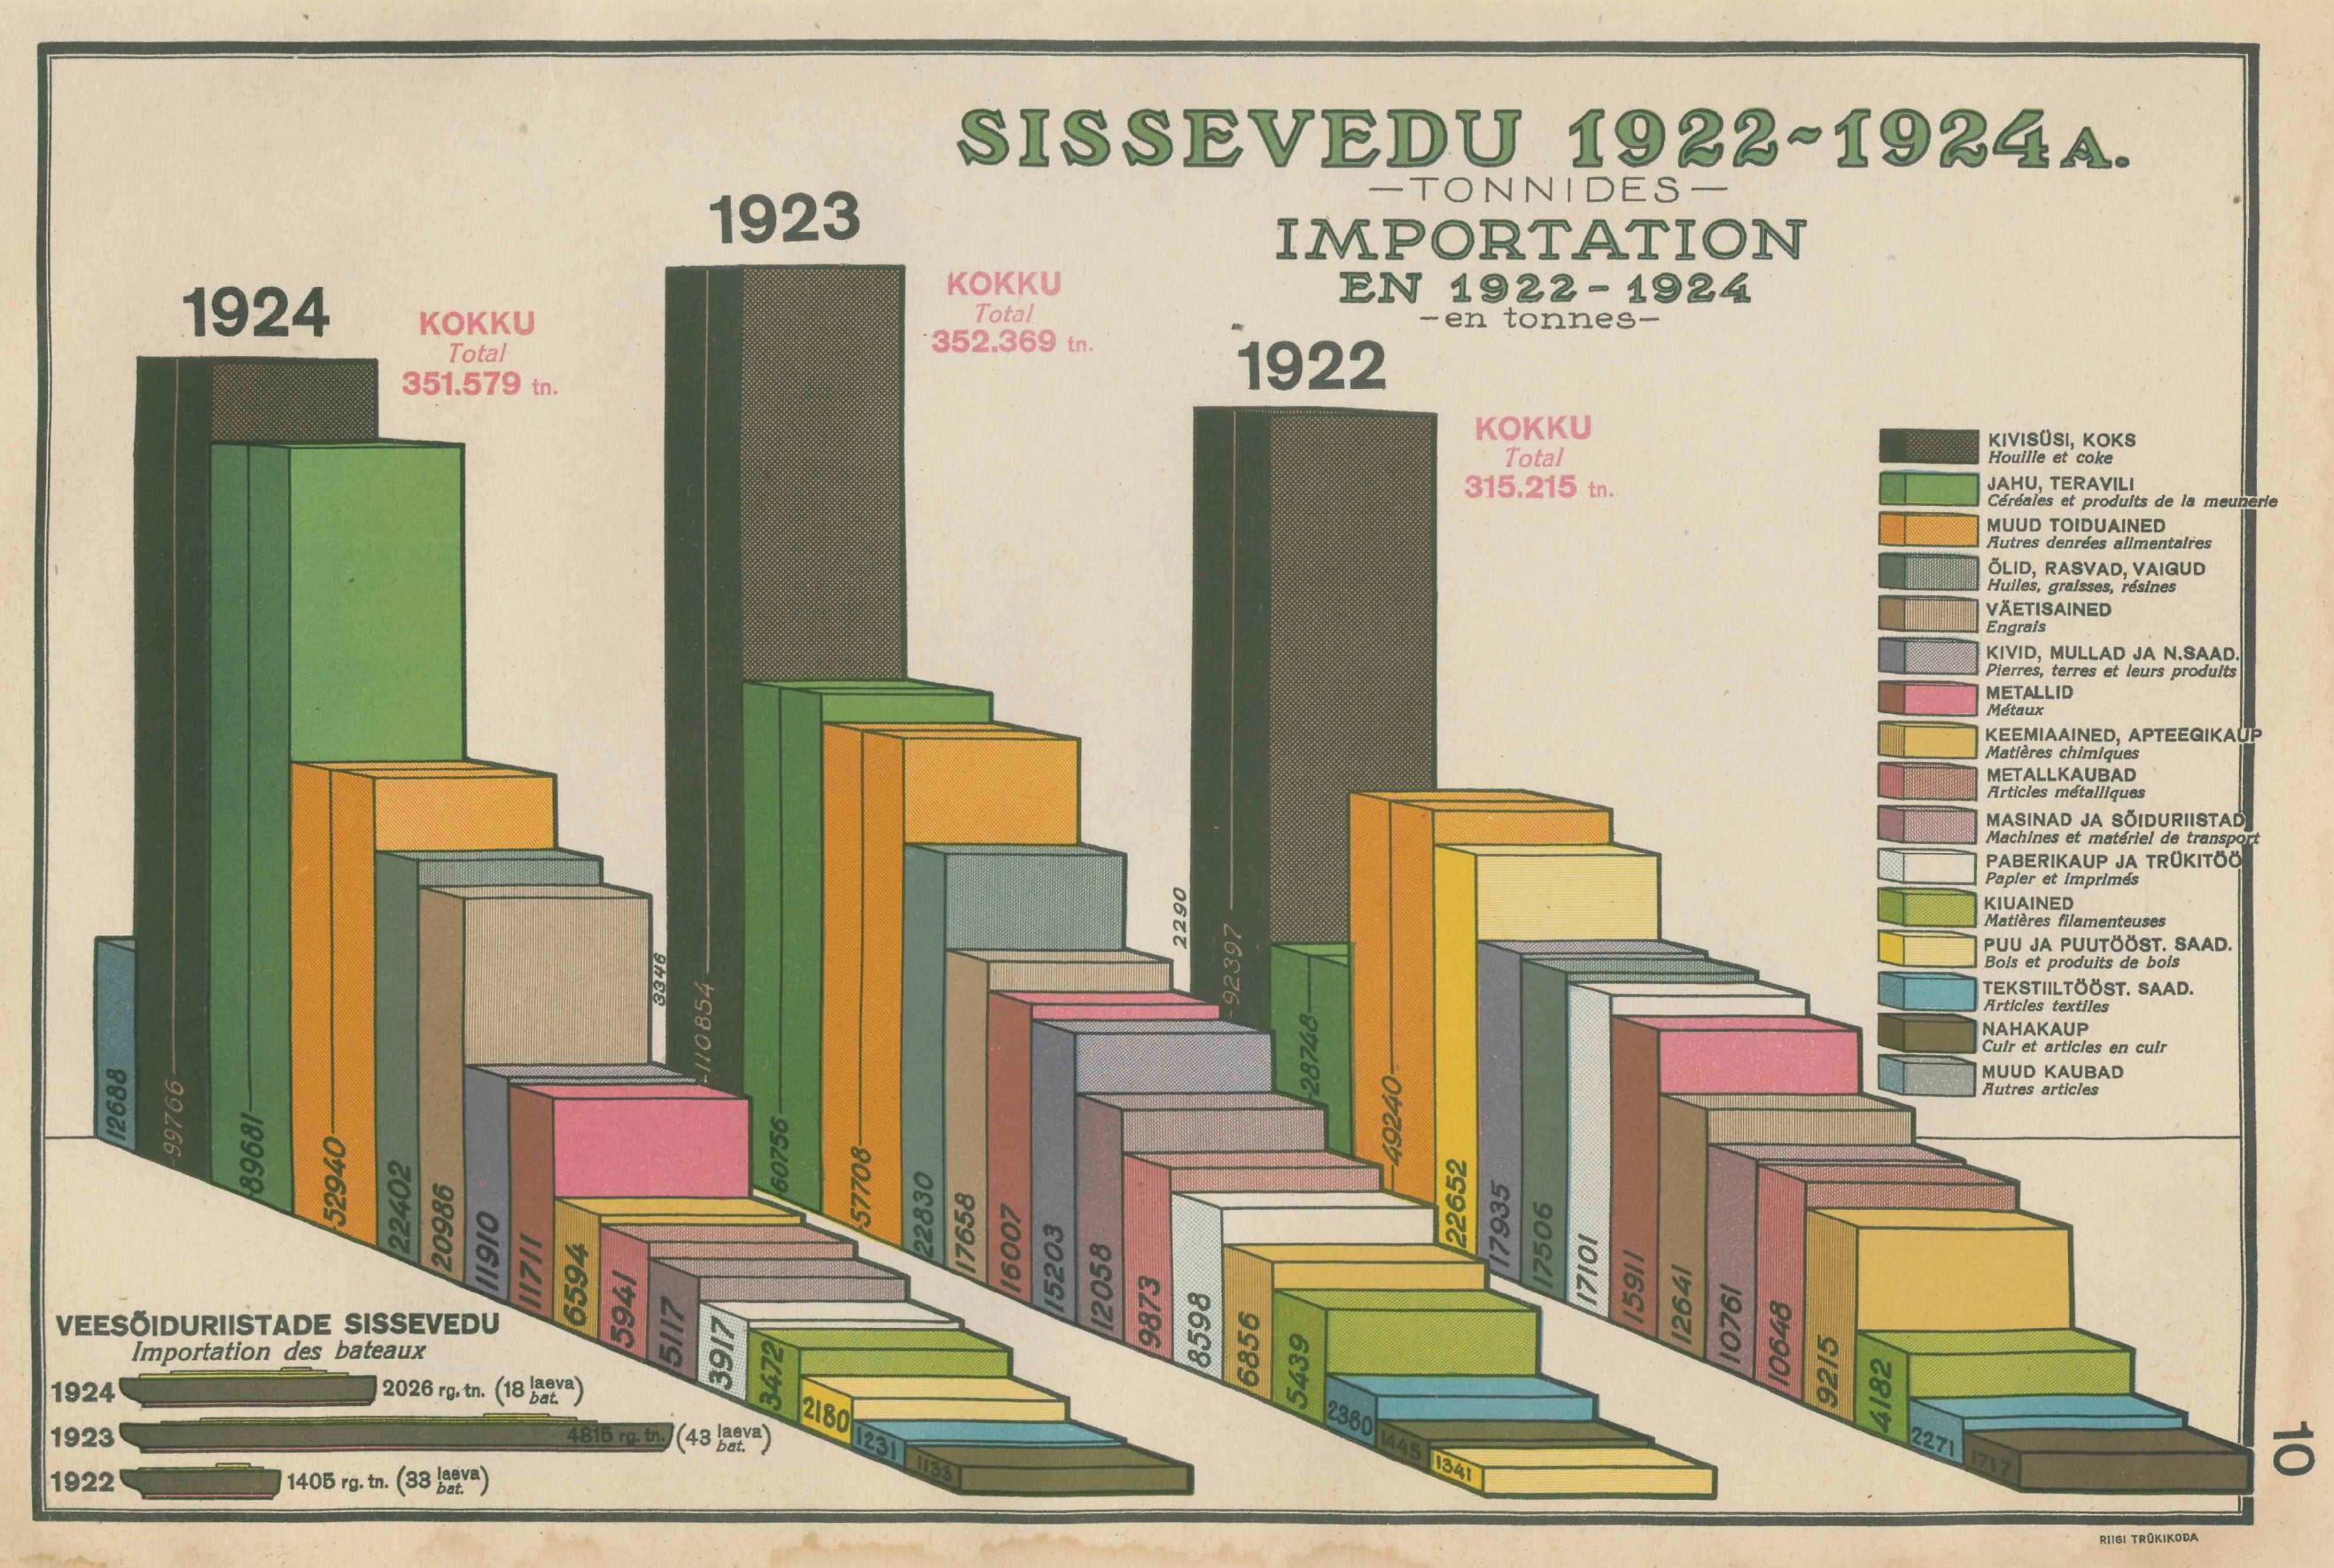
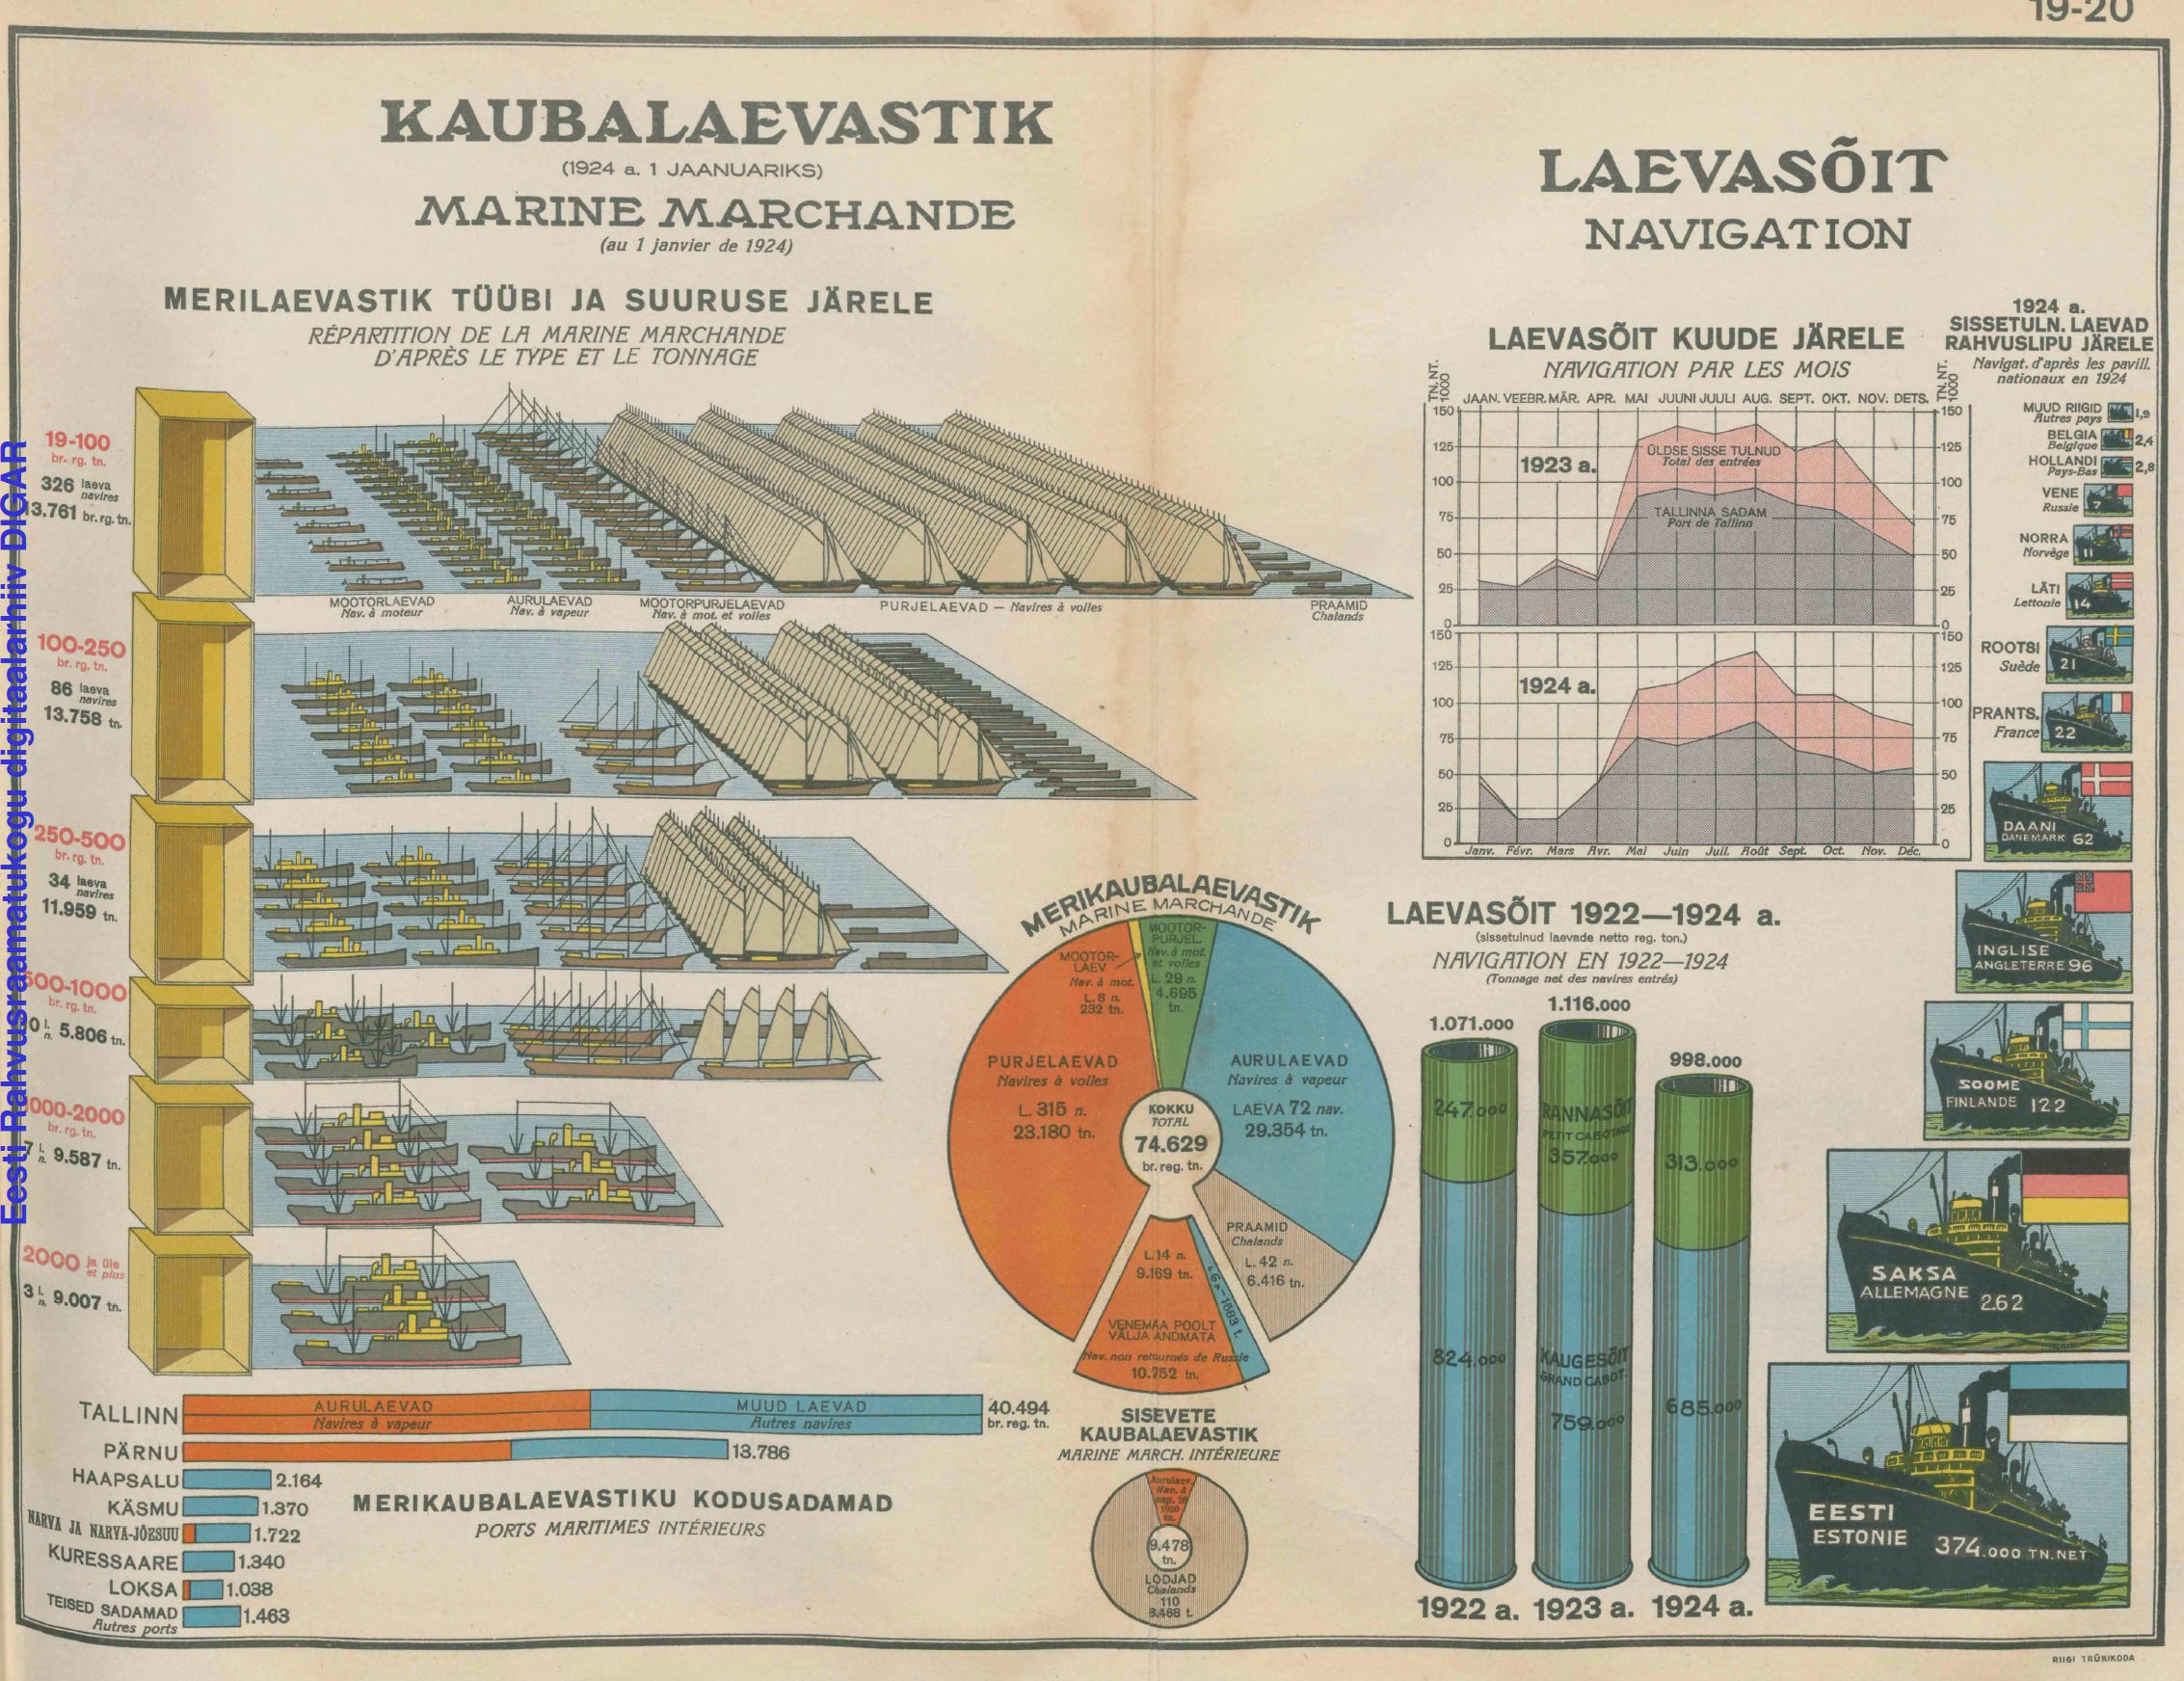
Statistical album Vol. II. Economy
Compiled by Viktor Schmidt
Tallin: Central Statistical Bureau/State Printing House (Riigi Trükidoda), 1926
Source: National Library of Estonia/Digar
Agriculture in Estonia
Edited by A. Pullerits
Tallin: Central Statistical Bureau/State Printing House (Riigi Trükidoda), 1928
Source: National Library of Estonia/Digar
Lithuania
Lietuva Skaitmenimis 1918–1928/La Lithuanie en chiffres - album de diagrammes
Central Statistical Bureau/Ministry of Finances, 1928
Source: Archive.org


Italy
Lo sviluppo dell’industria italiana
Rome: Confederazione generale fascista dell'industria italiana/Associzaione fra le società italiane per azioni 1929
Source: David Rumsey Map Collection


It’s actually surprising that, given how popular Hickmann was in his own time and even later until the 1930s, we know almost nothing about his life. For a long time, I, too, had overlooked Hickmann, until Paul Kahn, whose wonderful new book, Mapping Knowledge Across Time has just been published, drew my attention to him a few years ago.
Perhaps our aversion to pictorial statistics, which was widely used for propaganda, that causes us to keep our distance from it despite its popularity, and that has led to Hickmann’s name falling into almost oblivion. However, once I got my hands on a few of his atlases and was able to flip through them in physical form, Hickmann’s creativity and talent became clear. Many of his graphic solutions are exceptionally ingenious, and few scientists have devoted such care to the quality of their graphic design. If one looks more closely into Hickmann’s body of work, one will see that, in addition to his widely popular works, he also produced countless lesser-known statistical maps, booklets, and other atlases.
Very few people in the 19th century left behind such a substantial and influential body of statistical graphic work. A couple of enthusiasts of the history of data visualisation cherish his memory, but not a single journal article has been published on his work in statistics and cartography. It would be great if someone were to write a fitting biography of his life and oeuvre.2 It’s also possible that someone wrote it, but I just haven’t found it. If that’s the case, please let me know!
Others have also suggested that Hickmann’s work can be regarded as a precursor to Isotype. Although Otto Neurath makes no mention of Hickmann or his atlases in his visual autobiography, From Hieroglyphics to Isotype, originally published in 1945, the role played by Alois Fischer – who took over the editing of Hickmann’s atlas – in the development of Isotype would be worth exploring in greater depth.
About the of Alois Fischer (Fischer von der Eger, Ficher-Egerbrück) and his connections to the Neuraths and the Isotype, see a whole chapter in: Christopher Burke and Günther Sandner: History and Legacy of Isotype. London: Bloomsbury, 2024, pp. 66–72, and especially pp. 109–110. Open Access. His Isotype-booklets as the scientific director of the Austrian Institute of Pictorial Statistics are digitized by the Otto Neurath Digital Archive of the Museum of Society and Economy, Vienna. Let me make a remark here. While several authors have drawn attention to the tenuous connection between Hickmann and Isotype, and Burke and Sandner also refer to Hickmann’s Russian translations in connection with the Izostat’s pictorial traditions (p. 48), Fischer’s possible role as a bridge between Hickmann and Isotype remains unexplored.
As with other things, it’s not worth relying on AI for this either. There is an AI-generated biography of Hickmann on the internet what I don’t link here, and it’s full of errors, inaccuracies, contradictions, and fabrications.

AMAZING!!!!! So many very cool projects and designs that (the modern world?) hasn't seen before!