
How we wrote about data visualization?
Some lessons from 150 years of Hungarian literature.

Today’s post will be a little different from usual, as I’m due to submit the final draft of my new book to my publisher in the coming days.
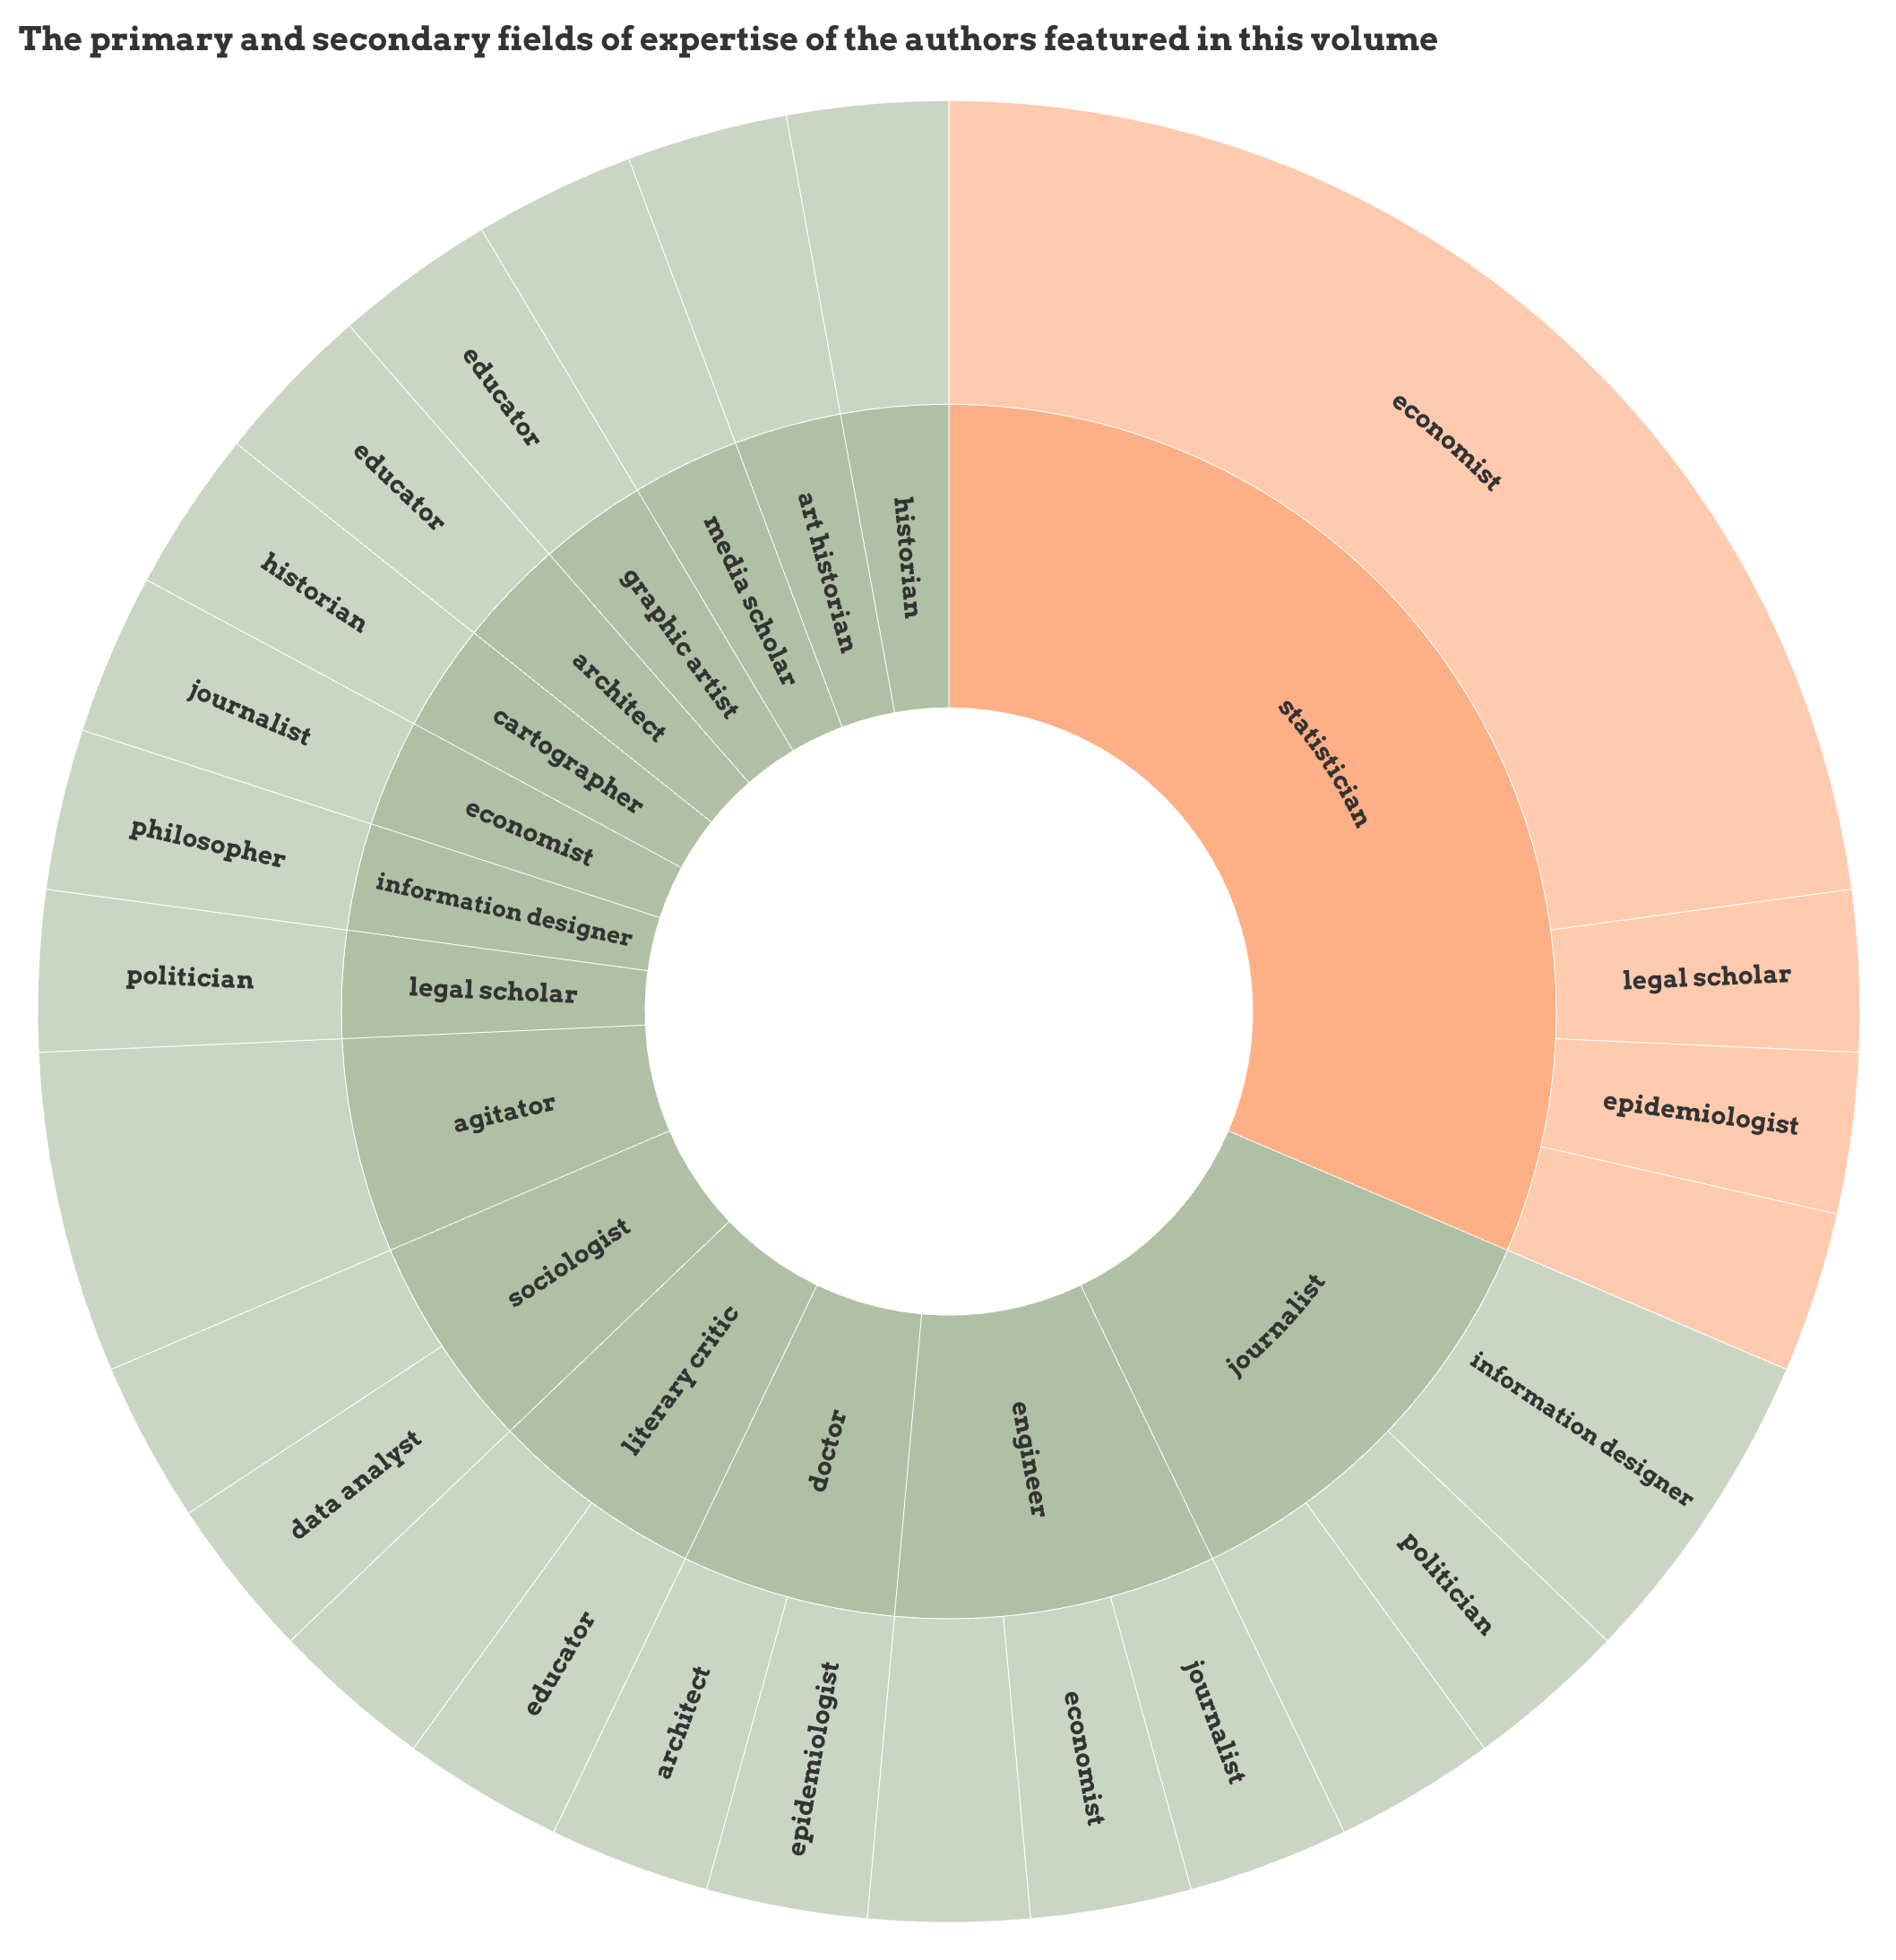
The book explores how, over the past 150 years, Hungarian statisticians, economists, engineers, doctors, journalists, graphic artist, and politicians have viewed the graphic presentation of data, what they wrote about it, which aspects they emphasized, and what they considered its advantages and disadvantages.
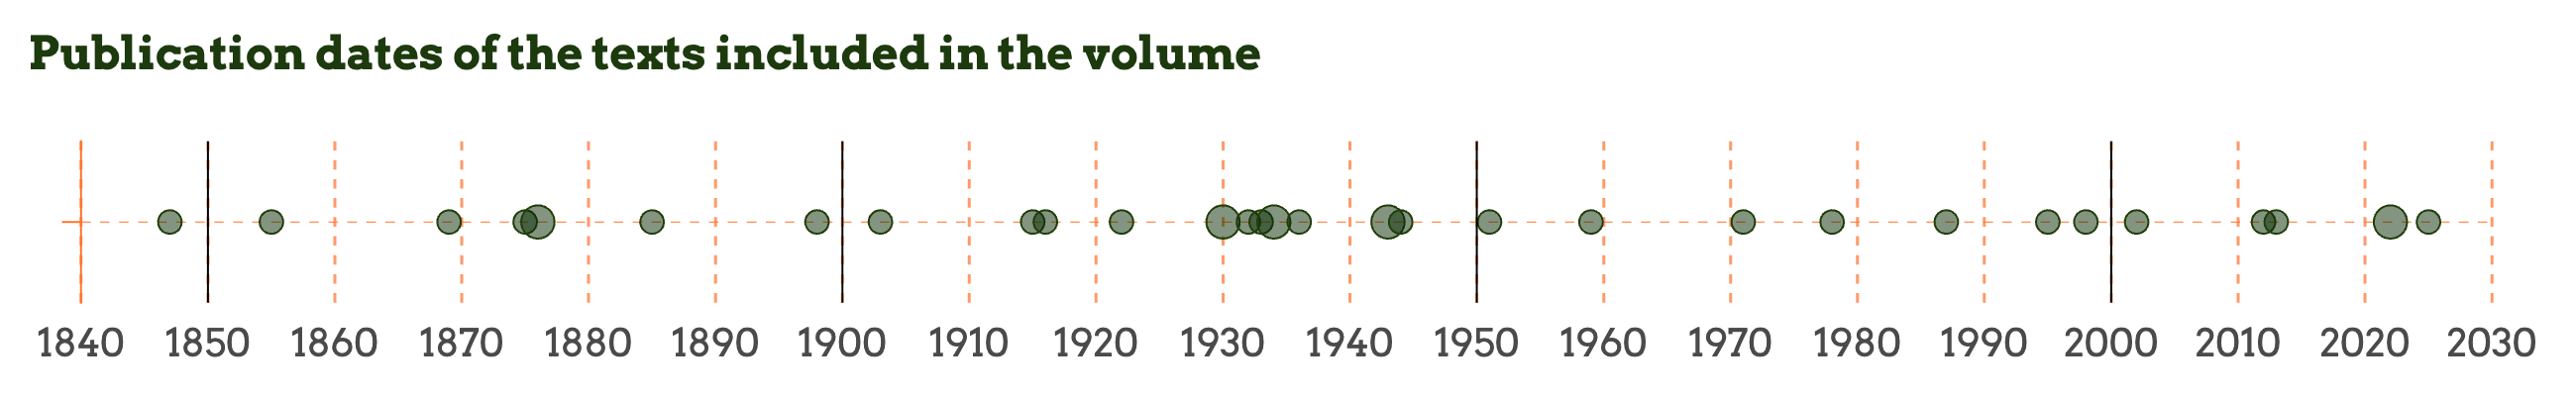
The backbone of the book consists of more than thirty excerpts of varying lengths, presented in chronological order. I have written a longer introductory, analytical essay and an epilogue to these writings, and the texts are also accompanied by more than forty images and three hundred notes.
What’s the point of all this?
For quite some time now, I’ve been interested in what kind of knowledge base Hungarian scholars and experts who worked on and wrote about the graphic presentation of data actually possessed. What did they read and know, where did they get their examples, and what inspired them? And finally, how did they pass on this knowledge? On the other hand, I was also interested in how and when new theories, insights, perspectives, and findings from the international literature were incorporated into Hungarian-language publications.
When RJ Andrews launched his “Summer of Clarity” series on Chartography last summer, focusing on classic English/Scottish (Playfair) American (Brinton/Hubbard, Karsten), French (Barbeu-Dubourg, Minard, Levasseur) and German (Mayr, Auerbach) manuals and handbook on data graphics, I finally decided to compile all the available Hungarian resources.
Collecting and selecting the texts was an exciting task in itself. In addition to numerous texts already known from earlier sources, there are many that truly had to be unearthed from the depths of oblivion.
Who spoke?
One of the most interesting findings of the analysis is how differently people in different professions wrote about data graphics.
The tendency to overlook the broader connections between (image) theory and visual culture in general, as well as epistemology and ideology is particularly evident among generations of statisticians and economists. Their focus is on methodology, precision, practicality, clarity, the description of diagram types, and their classification. This is understandable from the perspective that these texts are primarily addressed to current and future professionals in the field, as representatives of a closed scientific profession. Their writings are produced for a narrow professional/academic audience, and their quality is measured according to the standards and expectations of that specific audience. Thus, the recognition and emphasis that normative practice itself is not merely a matter of technical knowledge, but has numerous meanings, cultural contexts, and interpretive possibilities, does not appear in their work.
Although differences in perspective between various professions are also evident in the international literature: initially, German, French, and somewhat later American statistical/engineering and business literature was far more goal-oriented and focused on use and application. Of course, starting in the 1960s, this shifted towards a more theoretical direction, first under the influence of French and American semiotics, and later under the influence of various, primarily German and American image theories. The statistical-mathematical and accounting-based normative tradition was enriched (or, according to others, loosened) from the practical side by the partly pragmatic, partly communicative-rhetorical, and partly aesthetic perspectives of graphic designers and journalists. It is also worth noting that none of the statisticians and economists who discussed data graphics in their writings—with a few exceptions—created data graphics or maps. In their works, simple diagrams and statistical maps appear only sporadically, and often they did not even create them themselves. This is precisely why one might get the impression that these authors wrote about graphic methods only out of necessity. While they did not reject the graphic presentation of data, they by no means considered its use necessary, and they distinguished between abstract representations and cartograms, as well as pictorial statistical methods. They saw the latter as useful only for educating and informing the uneducated, illiterate and elementary school children.
Looking at the genres, the majority of the texts are methodological descriptions of varying lengths. It is telling that, unlike in the international literature, no standalone handbook appeared until quite recently—unless we consider György Rejtő’s 1951 or István Klinghammer’s 1975 short booklet as such. Until the 1990s, the graphics, figures and illustrations in manuals and statistical books were black and white, which, in addition to technological and financial constraints, may also reflect the field’s status as well as publishers’ limited enthusiasm.
When they were speaking?
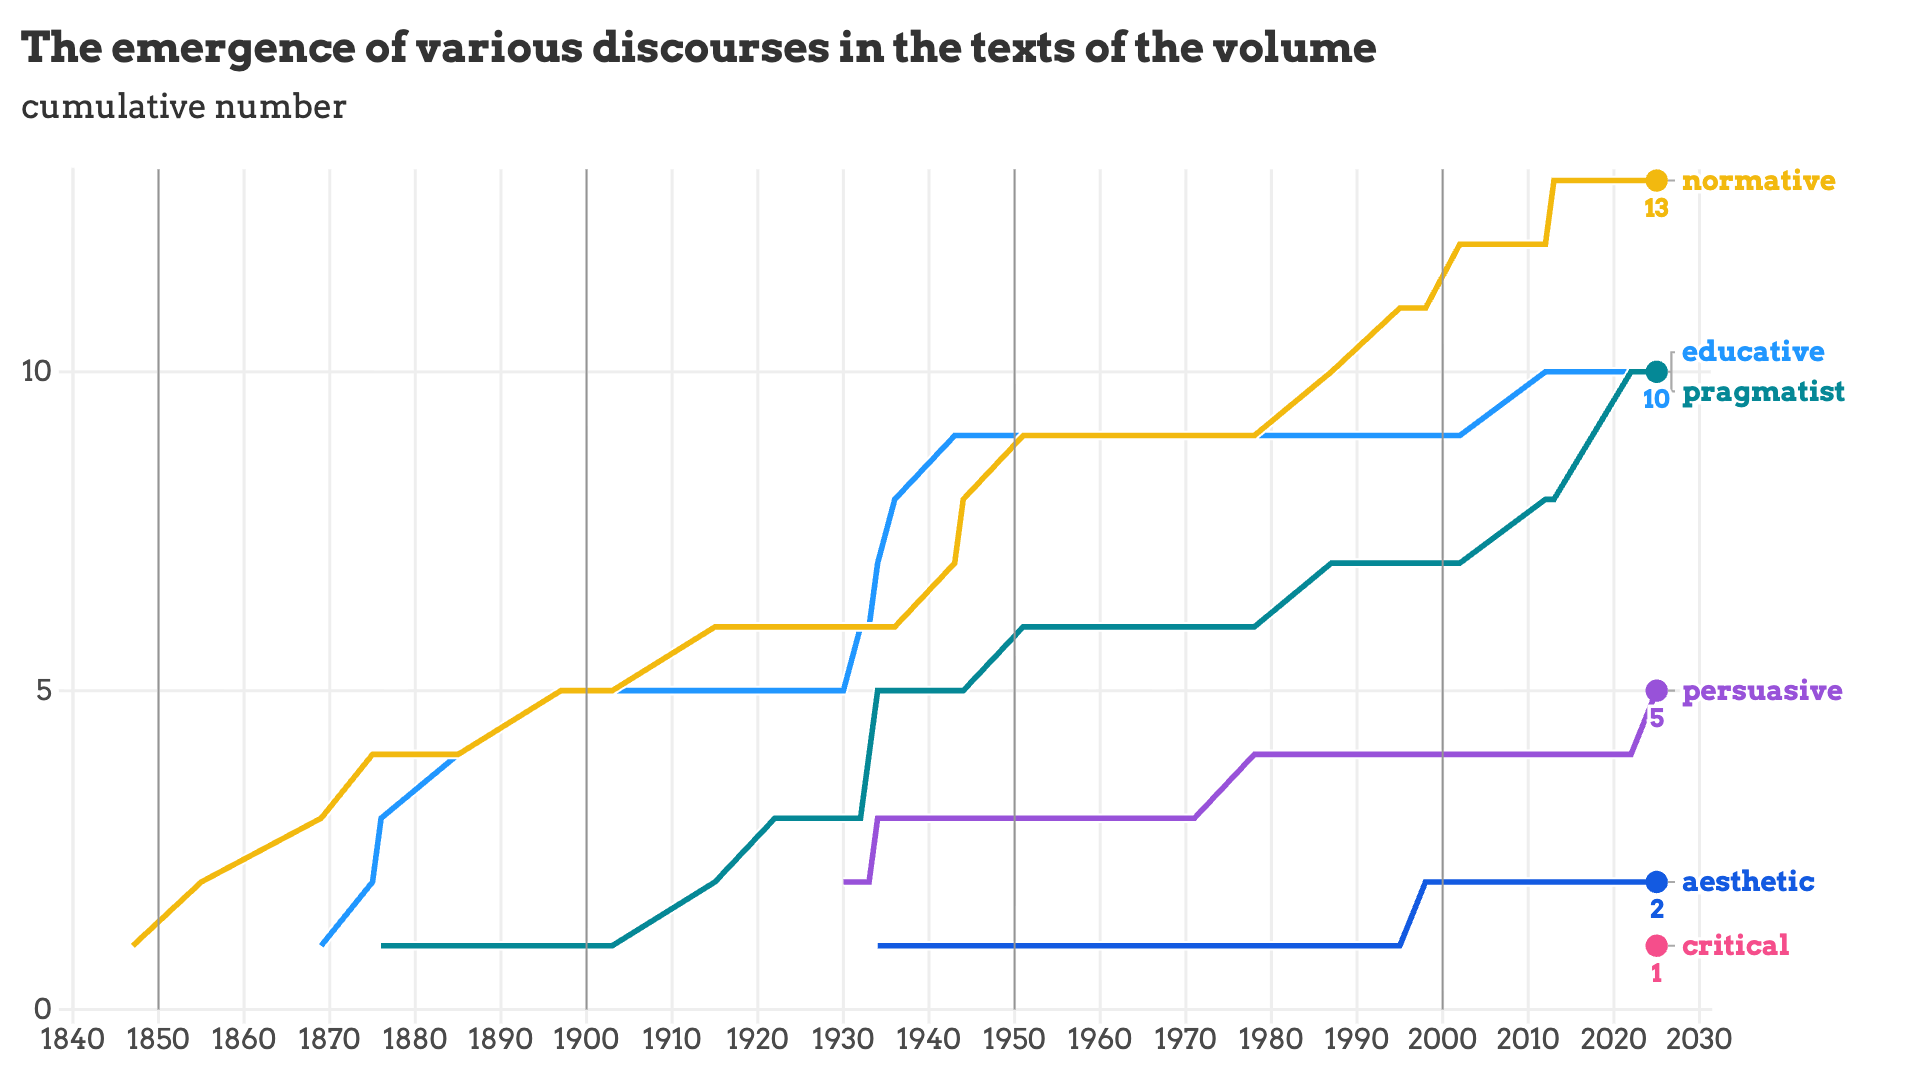
A chronology is useful for determining when certain ideas and trends first appear in Hungarian literature. The overall picture is varied. Strictly statistical literature, with its austere nature, generally keeps pace with international literature. Psychology and the concept of business utility, however, lagged behind American and French literature by twenty to twenty-five years. Conversely, the findings of semiotics and semiology, as well as the emergence of image theory, can be considered early, and critical-ideological discourse also quickly found its way among certain contemporary authors.
This chronological structure, however, also highlights a striking absence: the void of the 1970s and 1980s. This does not mean that no works or articles were published during this period in which we could not have encountered dry descriptions of graphic methods. In fact, the ever-growing number of university lecture notes designed to aid in the teaching of statistics, all dealt with the graphics method. Interestingly, however, the trend in these books had already shifted away from devoting more and more space to the graphical method; authors of the era generally wrote only a few pages about it, in a cookie-cutter style. More significantly, however, no new aspects appear in these books. Yet if there is an era that internationally produced works turning traditional approaches to data graphics on their head, it is precisely this period of just over twenty years.
What did they know?
It is striking that, until quite recently, the majority of authors were either unaware of or did not cite relevant earlier and contemporary international literature. Particularly in light of German scholarship, it is interesting that they ignore the methodological works of Georg von Mayr or Felix Auerbach, which were well known in their time, but they likewise make no mention of the foundational works of the French scholars Étienne-Jules Marey and Émile Levasseur. Later, the absence of the American “business” wave—handbooks incorporating economic analytics, such as the classics by Willard C. Brinton, Karl G. Karsten, Allan C. Haskell, or John R. Riggleman—is remarkable. This is surprising for several reasons. The aforementioned giants of German and French statistics were not only leading figures in the scientific literature, but the Hungarian popular newspapers also regularly reported on their researches. Furthermore, their handbooks were available in the domestic library collections of the time.
Of course, there may be reasons for the lack of citations. One is that in the 19th century, citation practices in scholarly literature were not yet strictly regulated in Hungary, and authors often cited other authors as authorities rather than specific works. Bibliographic references at the end of texts were also relatively rare. Another reason is that authors may have considered certain statements self-evident and did not feel the need to cite the source of established knowledge.
This does not mean that the ideas of these authors did not appear in the works of certain writers. The influence of Georg von Mayr, Karsten, Neurath, later of Jacques Bertin is detectable in many texts. We also have examples, where the reception of Marey or Auerbach occurs sixty to eighty years later.
What kind of discourse did they represent?
In his 2000 book The Infographic. A History of Data Graphics and News Communication, British media researcher Murray Dick identified various schools of thought and discourses in the texts on data visualization that he analyzed. Using Dick’s categories—though with some modifications and additions—it is interesting to examine when and what kinds of discourses appear in these texts.
Don’t worry, everyone—we’ll be back to our regular schedule. We’ll have a piece on meat trade, on elections coming up soon, and we’ll also be featuring a special atlas too.