


A guest article by Aman Bhargava
Reading through the Cabinet, I often found myself wondering what I would find if I asked the same questions of India. Is there a distinct tradition of Indian data visualization? Identifying what even constitutes an “Indian” graphic is also an immediate hurdle. Historically, our most graphically expressive documents have been censuses. You can look as far back as 1871 and find choropleth maps tracking demographics, dense text and tables, and even Florence Nightingale’s illustrated observations on sanitation in British India. Yet, these graphics didn’t fully answer my question because they were produced by a colonial administration. They are undeniably a core part of our historical legacy because they laid the foundation for how a post-independence India would classify its people, but they were visualizations made not by or for them.
Thus, the search went on, examining the censuses conducted following India’s 1947 independence. Early independent censuses, like 1951 and 1961, didn’t show anything very interesting. But 1971 was a very different story, because my searches also turned up a bunch of documents I hadn’t seen before. Together with its customary, frighteningly dry census volumes, the Indian government released something in 1971 and 1981 that was essentially unprecedented.
Titled A Portrait of Population, these were state-specific booklets written in plain language and illustrated with hand-drawn charts, maps, pictograms, and photographs. They were designed not for researchers, scientists, or bureaucrats, but for ordinary readers. Students, curious citizens, anyone! People who would never, under normal circumstances, pick up a census report.
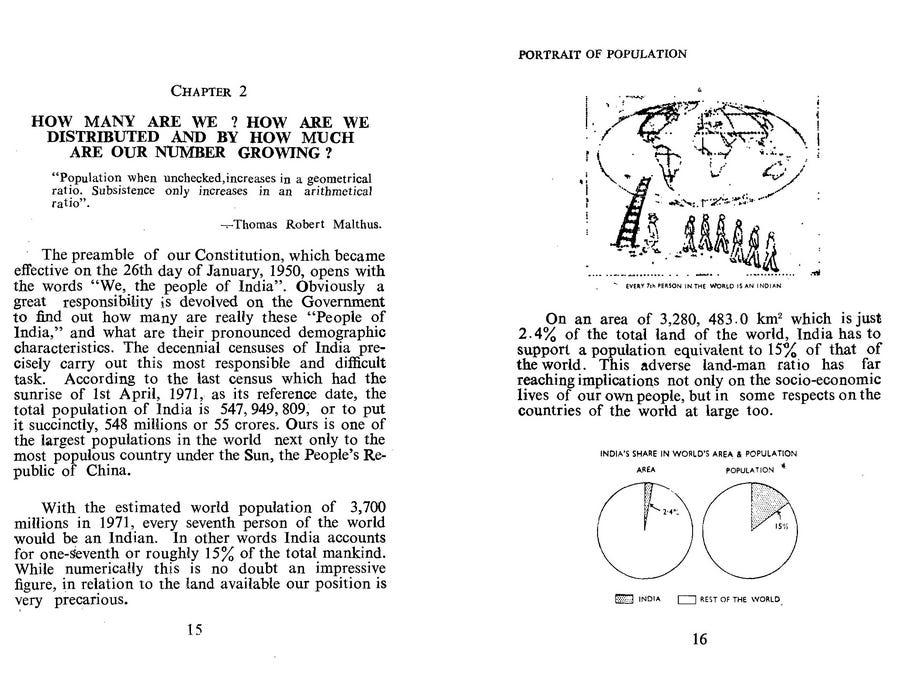
Each booklet shared a common foreword that stated that ambition clearly:
“This attempt to produce a popular version of the large census data for the general reader is an important innovation.”
Oh boy. I am unable to accurately express my enthusiasm, mainly due to my years of experience with modern government websites, portals, and documents, which have left me jaded. Their lack of accessibility—both technical and textual—has thwarted people like me at every turn. However, the government had prepared something for us, the lowly readers, right here? They actively wanted people to understand this data as clearly as possible? Get outta here! And so I began collecting each one of these I could find.
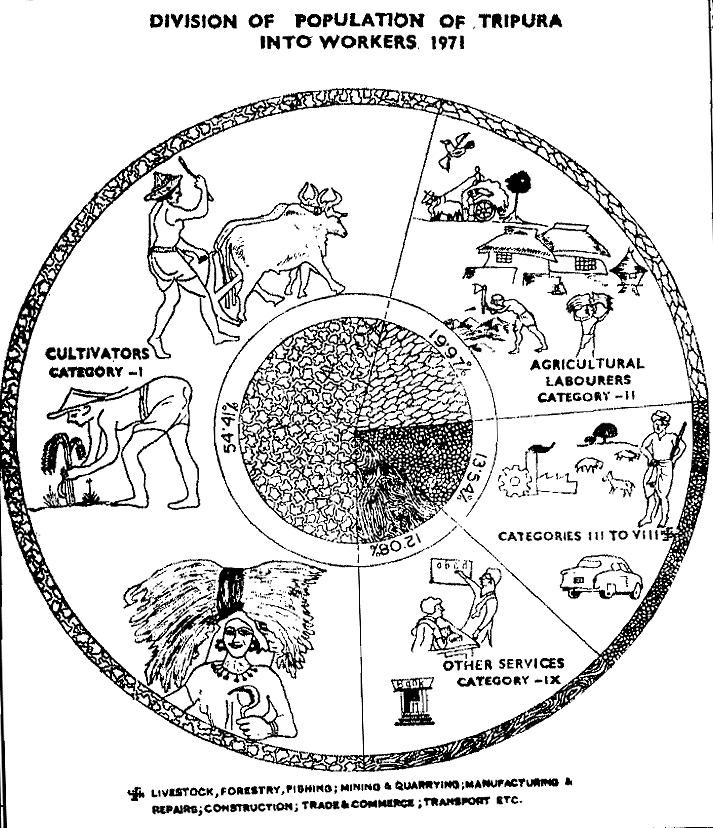
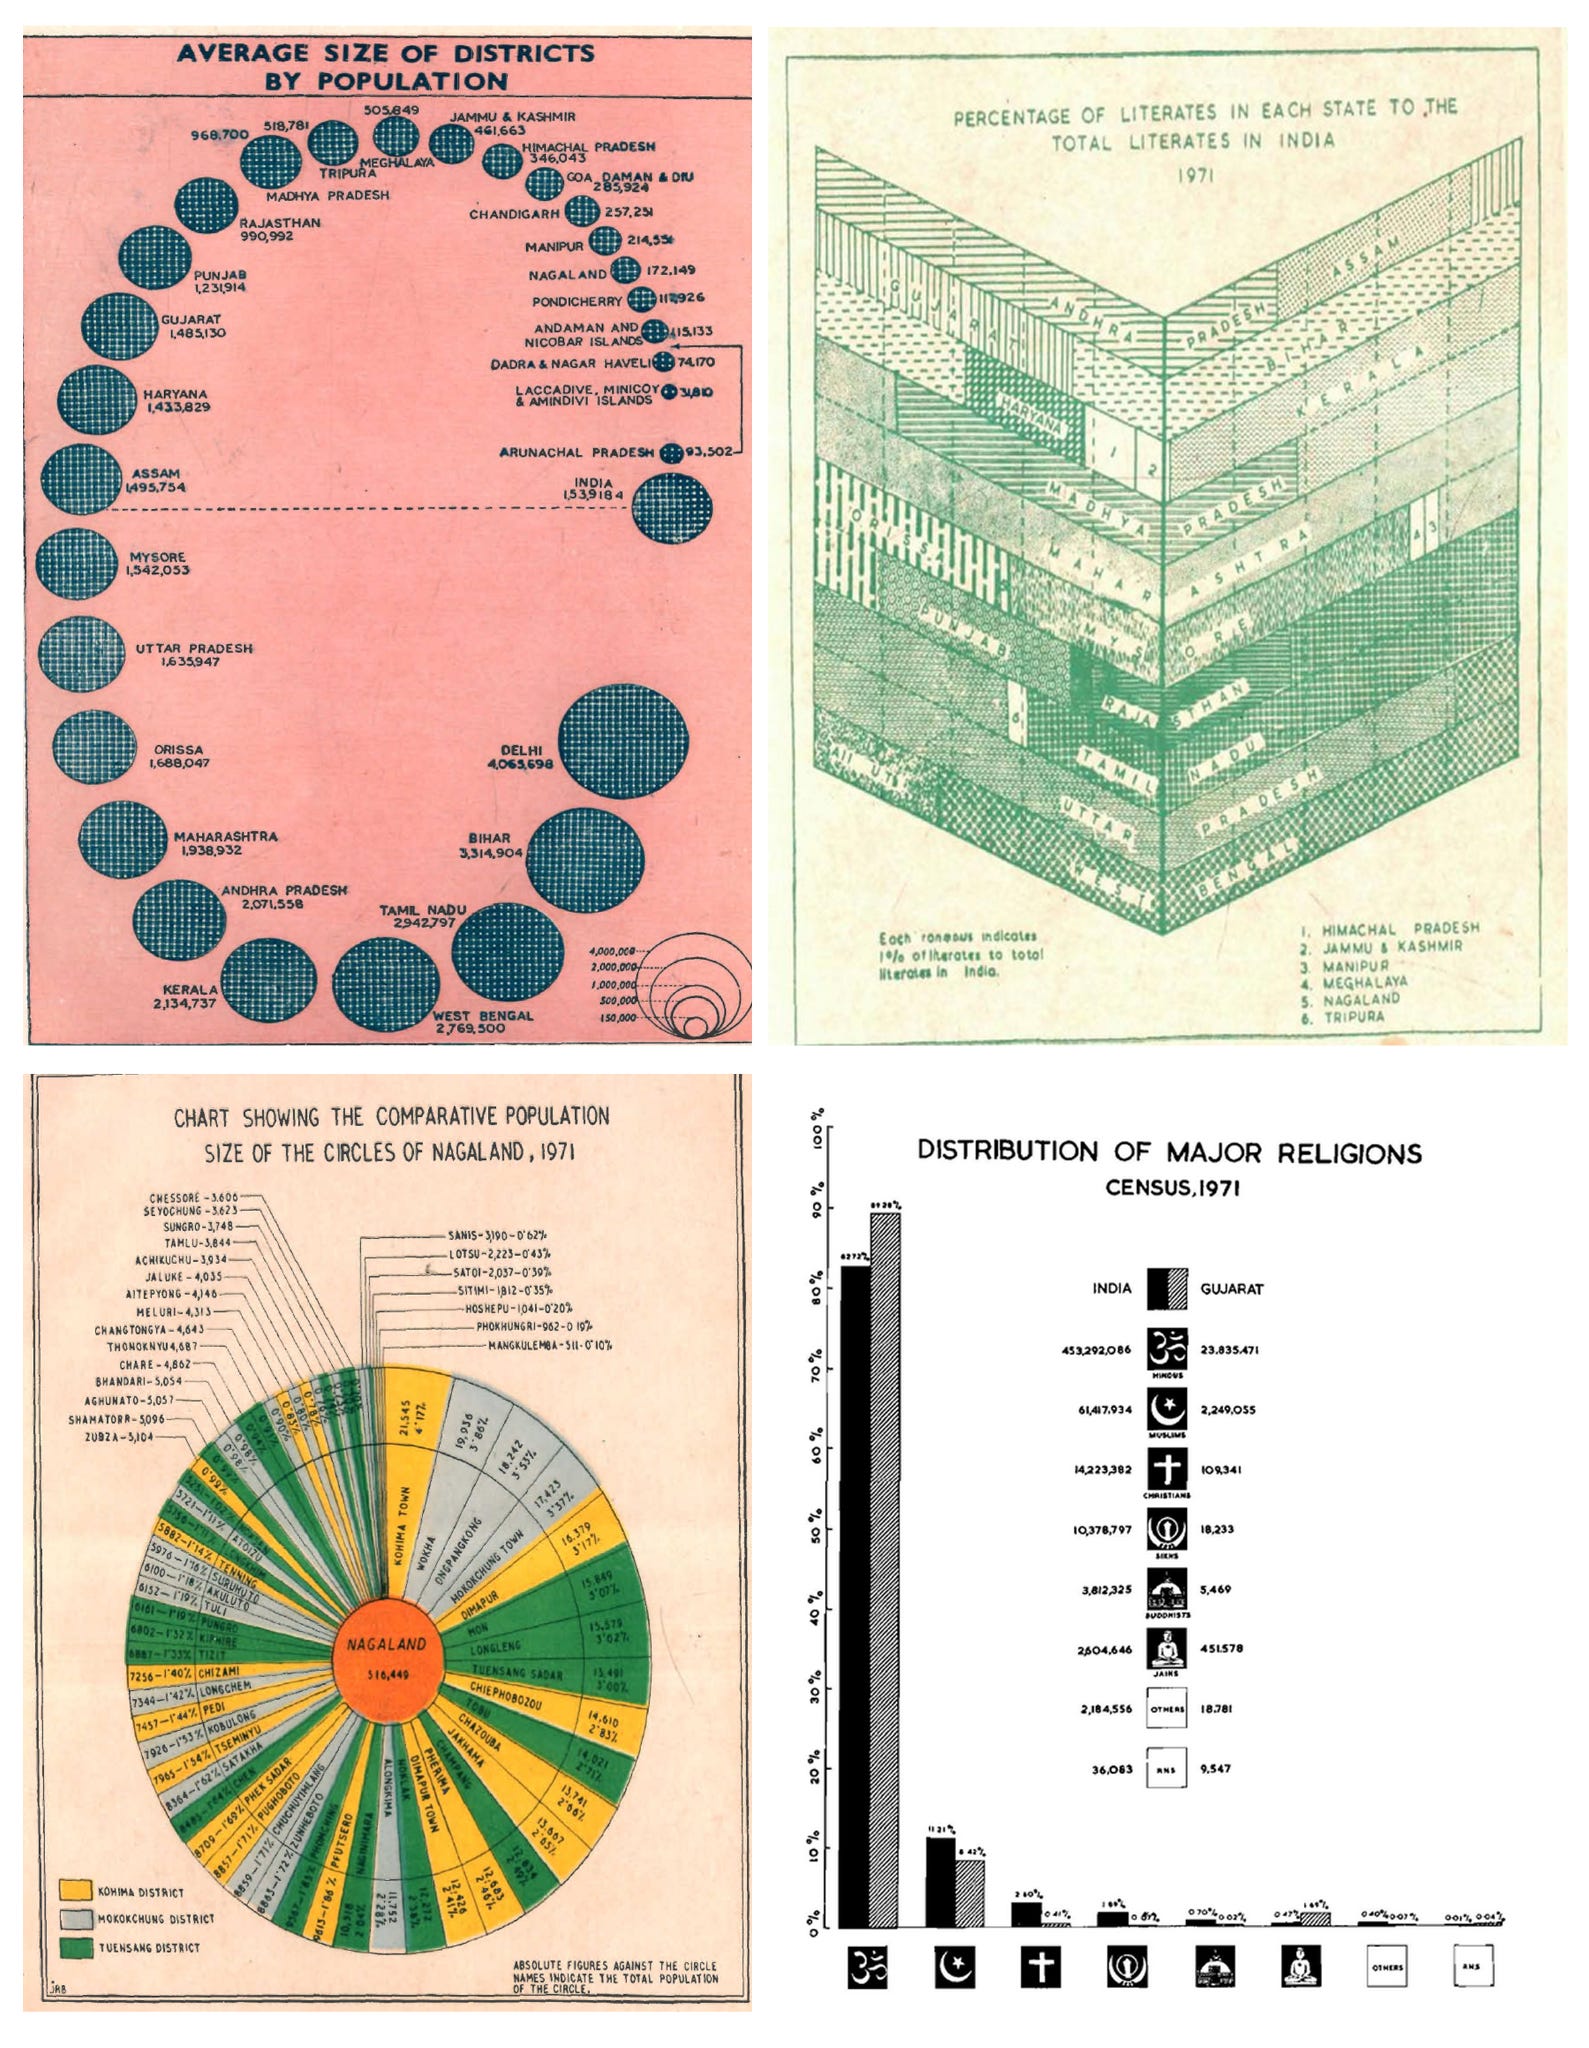
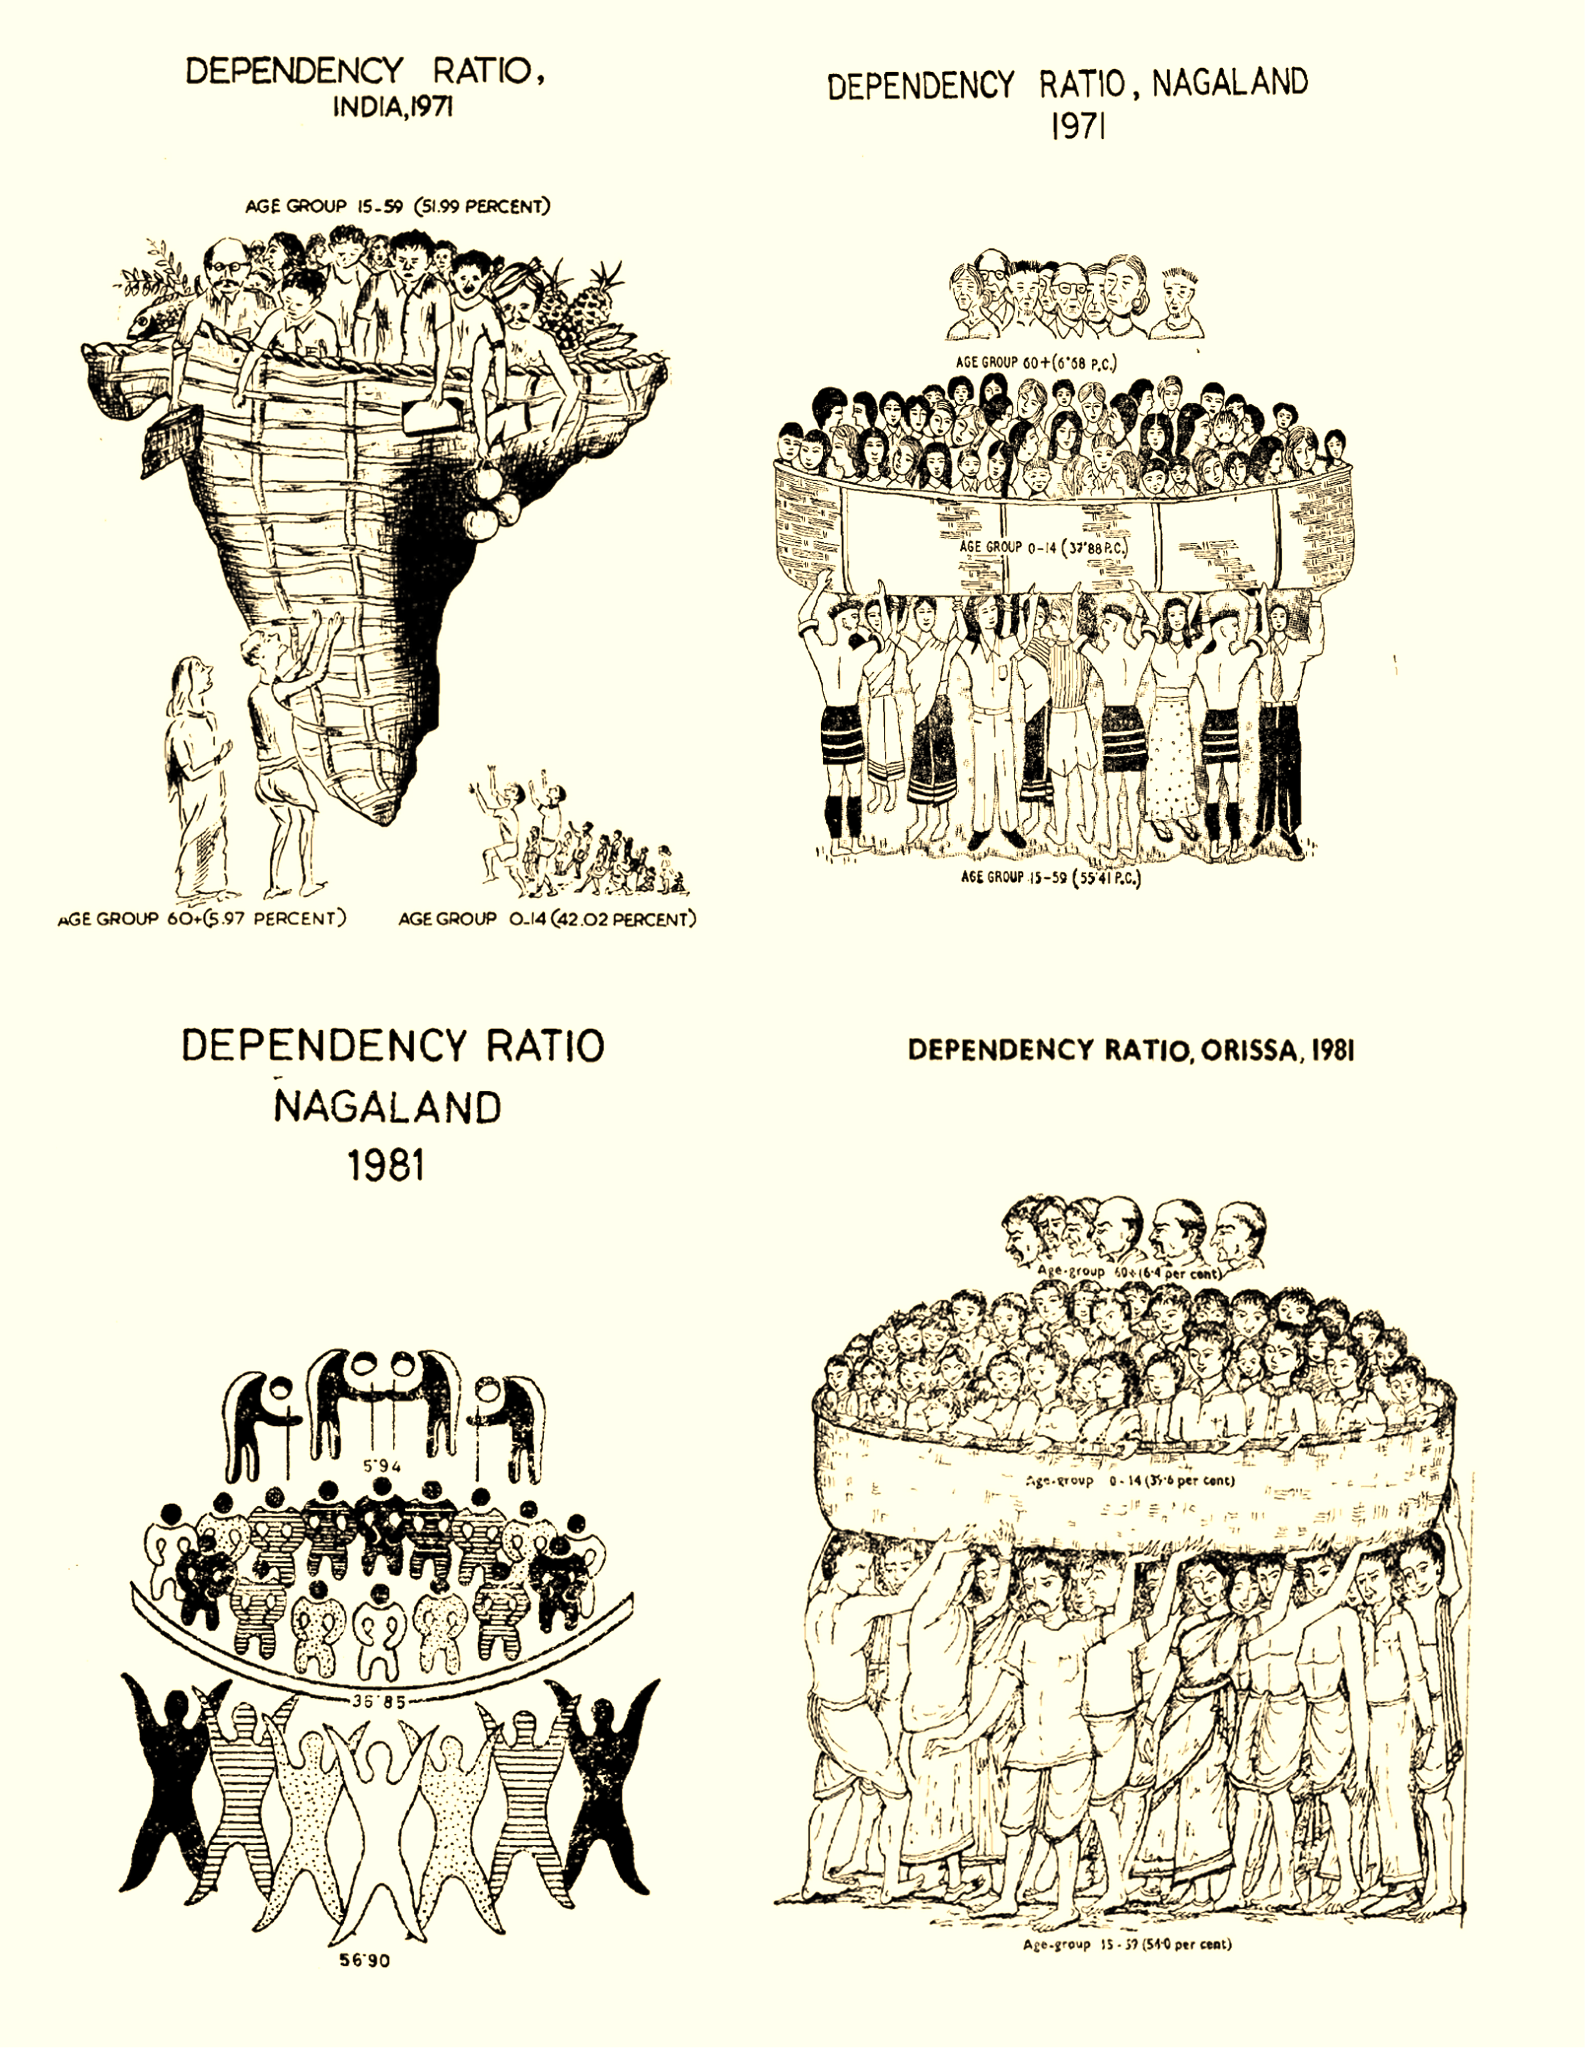
Each state office had relied on its own artists, draughtsmen, and cartographers. And I suppose since there were no shared tools, no default templates, and no software nudging everyone toward the same visual outputs, what they produced was genuinely distinct. Kerala’s charts look different from Odisha’s. Arunachal Pradesh’s colourful graphics have different sensibility than Gujarat’s. Some graphics are minimal line charts; others are elaborate pictograms. The most inventive ones abandon “data-viz” entirely, like dependency ratios rendered as literal illustrations of human figures stacked and balancing to show who supports whom in the economy.
This is an interesting find, but nothing that happens in government happens without a reason. Least of all something of this scale, which required dedicating not-insignificant human resources within departments that already had more than enough on their plates. Why did they bother? What exactly made it necessary to produce these documents in 1971? So we zoomed out to look at the other things being talked about within the government at the time.
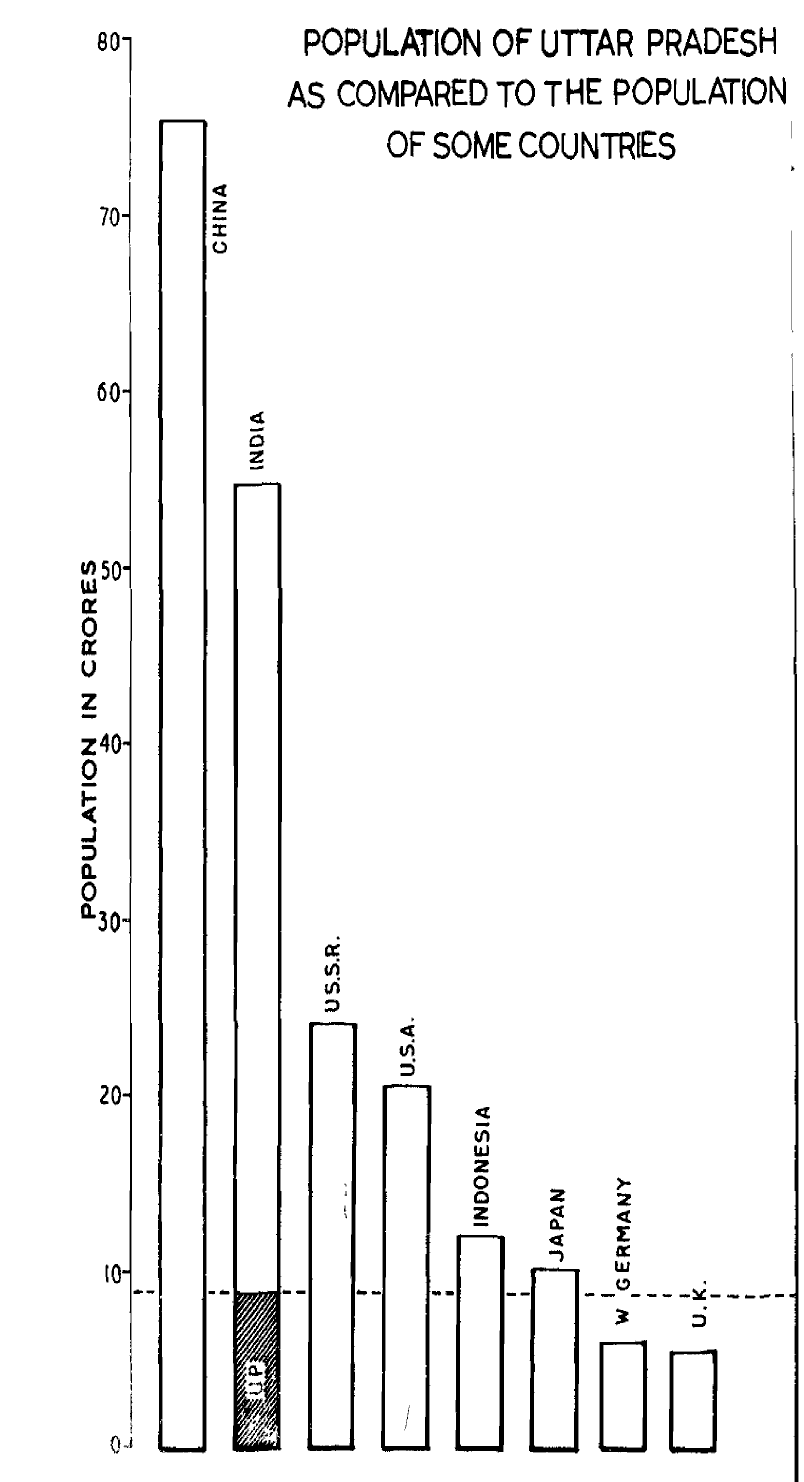
The 1960s and 70s were defined by a global panic over population growth. Paul Ehrlich’s The Population Bomb and The Limits to Growth which followed shortly after forecasted civilizational collapse due to unchecked growth. The UN would declare 1974 the World Population Year.
Wheels were also in motion in India to meet this agenda. In the 70s, this played out in some incredibly dark ways, most notably a mass forced-sterilization program that affected over eight million people in a single year mostly minorities across religion and the social strata. But this same anxiety also produced a parallel effort in education to help young people understand demographic concepts before they became, as the government essentially viewed it, the population problem themselves. In 1969, India’s Home Minister Y. B. Chavan put the challenge to census officials right before it began: How do you make this data interesting and educational to the common man? How do you make it attractive enough to read? The Portrait of Population series was, in part, the answer.
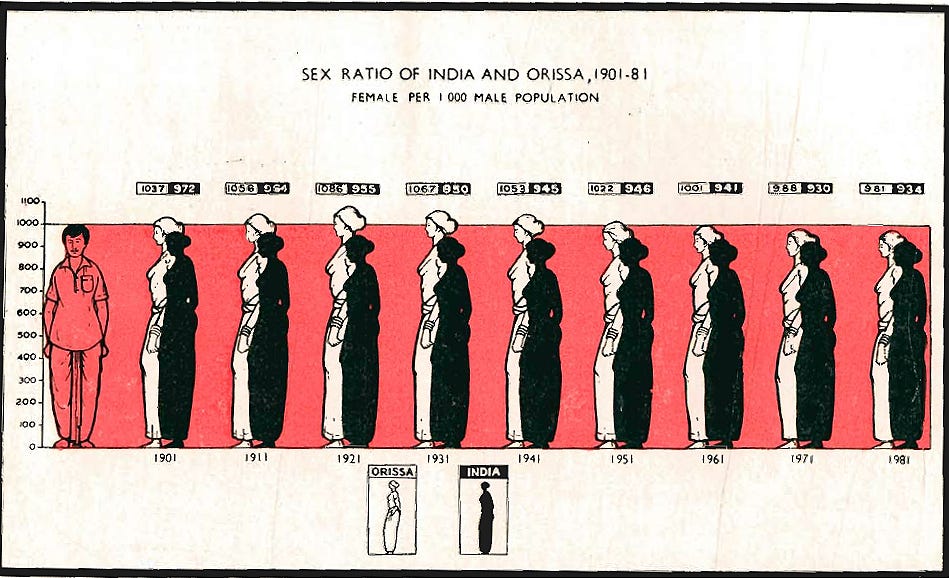
Government work doesn’t happen in silos, and different departments will work together towards a common goal in their own unique ways. Around the same time, people started to take demographic studies and research more seriously. Students and teachers needed to be given the tools they needed to understand and teach these new ideas in the classroom. Interestingly, data visualization was explicitly acknowledged as a critical component of this school’s curriculum. Official government syllabus documents from the period mandated that students develop the ability to “interpret simple line graphs, bar graphs, or pictograms” and present population data in “tabular, diagrammatic, pictorial and symbolic form.” In this way, visual literacy was beginning to be planned directly into the curriculum. It is difficult to say how successful this was, but it explains why the government would also want to publish official census booklets filled with graphics.
That era did not last long. By 1991, the Office of the Registrar General was already running workshops to train its cartographers in digital mapping and computer-assisted design, and the Portrait of Population series began to thin out. I can’t say for certain how digital tools changed the aesthetic because public copies from this period are hard to find. It’s reasonable to assume that as the government prioritized software-driven efficiency, these high-effort booklets simply fell off the priority list. This leaves us with a twenty-year window of hand-drawn Indian data visualization before software would nudge us all in one conventional, neater direction.
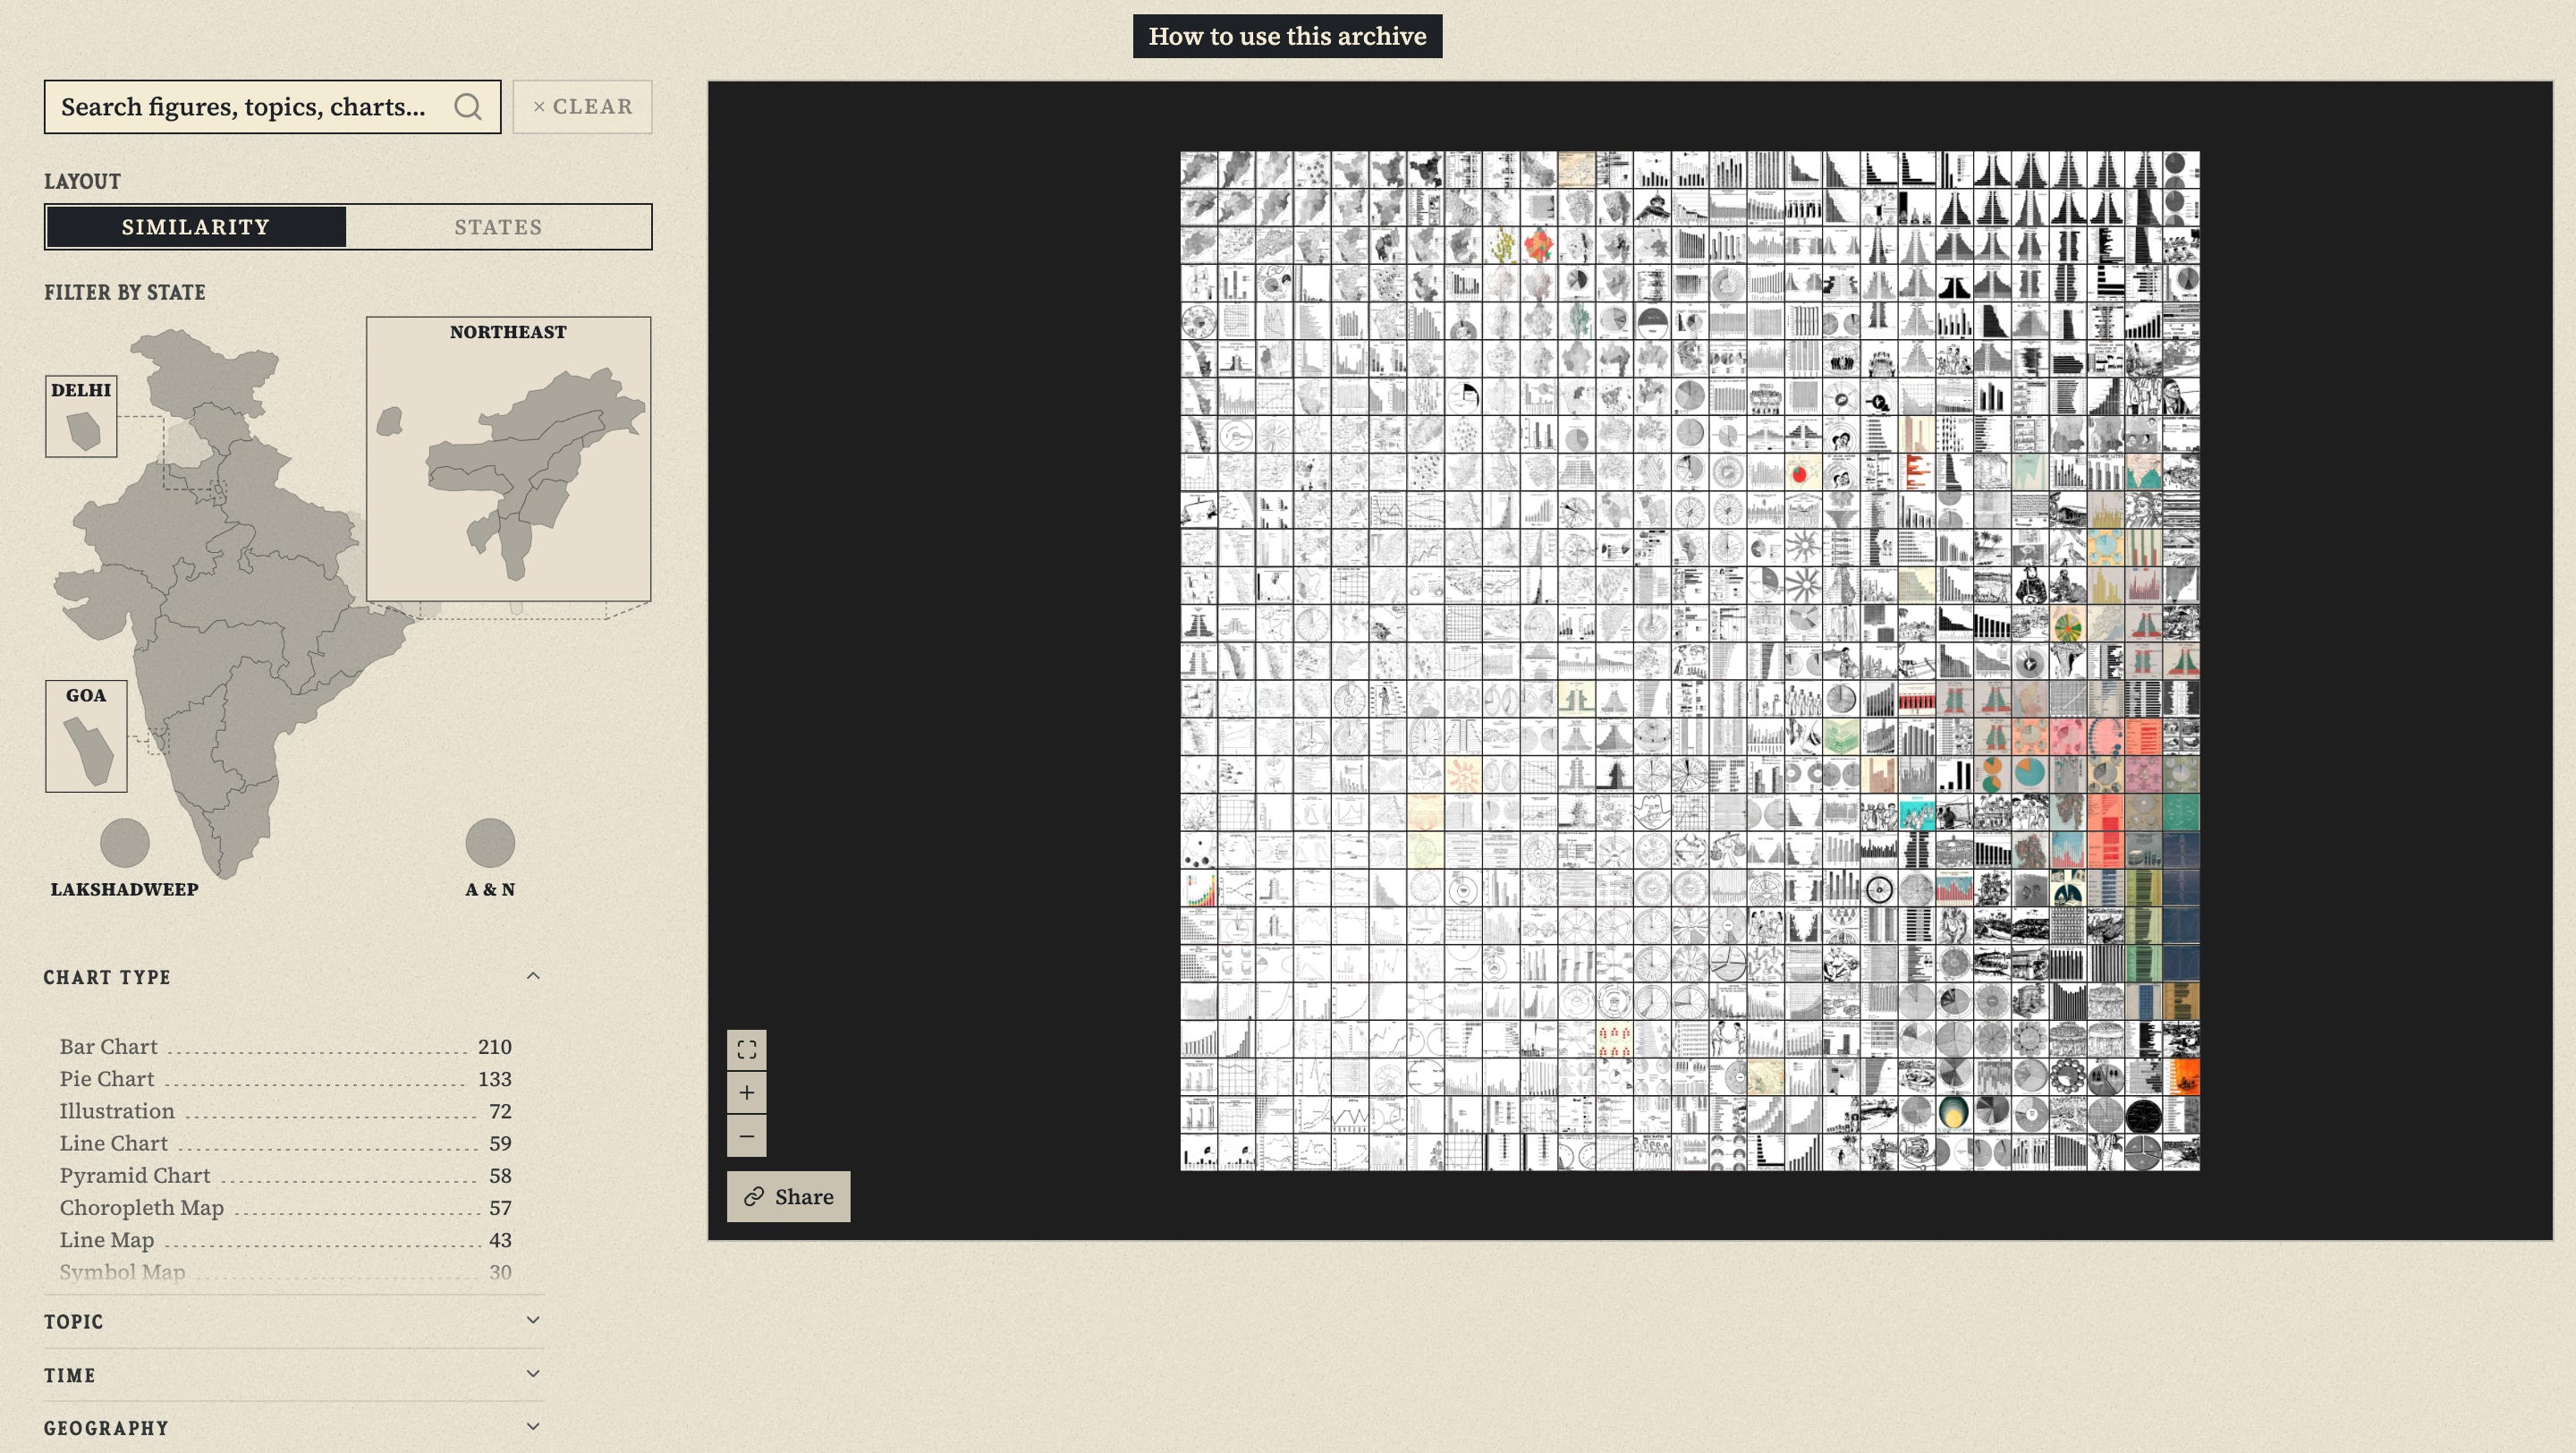
At Diagram Chasing, we extracted, categorized, and tagged nearly 700 of these visualizations. We have organized them by state, by chart type, and by visual similarity. The full, interactive archive is available in our explorer, and all the original booklets can be read in full on the Internet Archive. We’ve also got a longer, illustrated story about it that you might enjoy reading!
Aman Bhargava
Aman Bhargava is a developer, independent researcher, and chart maker. He specializes in civic tech and data visualization, with bylines in Reuters, Rest of World, and Unearthed by Greenpeace. He also co-runs Diagram Chasing, which is an independent data publication and community dedicated to turning Indian public data into compelling, visual stories and tools.
Other posts from the history of Asian dataviz




Loved this essay, and it's lovely to see data visualisations from the post-colonial era in India. I particularly loved the non-standardised versions across states, and will explore the Diagram Chasing collection at leisure. Such a pity that visualisations died out in syllabi since, as it would've been just the thing to make human geography interesting!