

The failure of marriage in the first photoviz
Marriage statistics on photomontages from 1899.

This is a method I have previously shared on Twitter. At the time, I could only say that those images appeared in a Hungarian illustrated literary magazine, founded and edited by then extremely popular, conservative Ferenc Herczeg, called Új Idők (New Times) in 1899 along with an article about a lecture on the failure of marriage. All I could add was that the images were probably French in origin, since according to the article, the lecture was given by a certain Mr. Saint-Aubin, a “statistician” and the article used his images.
Well, I haven’t been able to find out anything more since then. The Hymen company mentioned in the article did exist and was involved in matchmaking and marriage brokerage, and a certain Mr. Saint-Aubin gave a lecture on French marriage statistics on behalf of the company. The scientist and statistician named Saint-Aubin (also Saint-Auban, Auben, etc., in case it was misspelled) did not live during this period. At least, I couldn’t find any information about a statistician/scientist with that name. I could still be wrong. If that’s the case, please write to me! There is an other name in the article, “the scientist Brunetiére”, who - according to the article - had some critical remarks on modern science. This Brunetière is undoubtedly Ferdinand Brunetière (1849–1906), a French conservative and Catholic critic, writer, editor, pampleteer and public intellectual, who was not, however, a scientist.
According to the article, Saint-Aubin’s presentation was rather ominous in terms of marriage and the willingness to have children in France, Germany, Russia and the Scandinavian countries. What makes the article interesting from our point of view are the data presentations accompanying it.
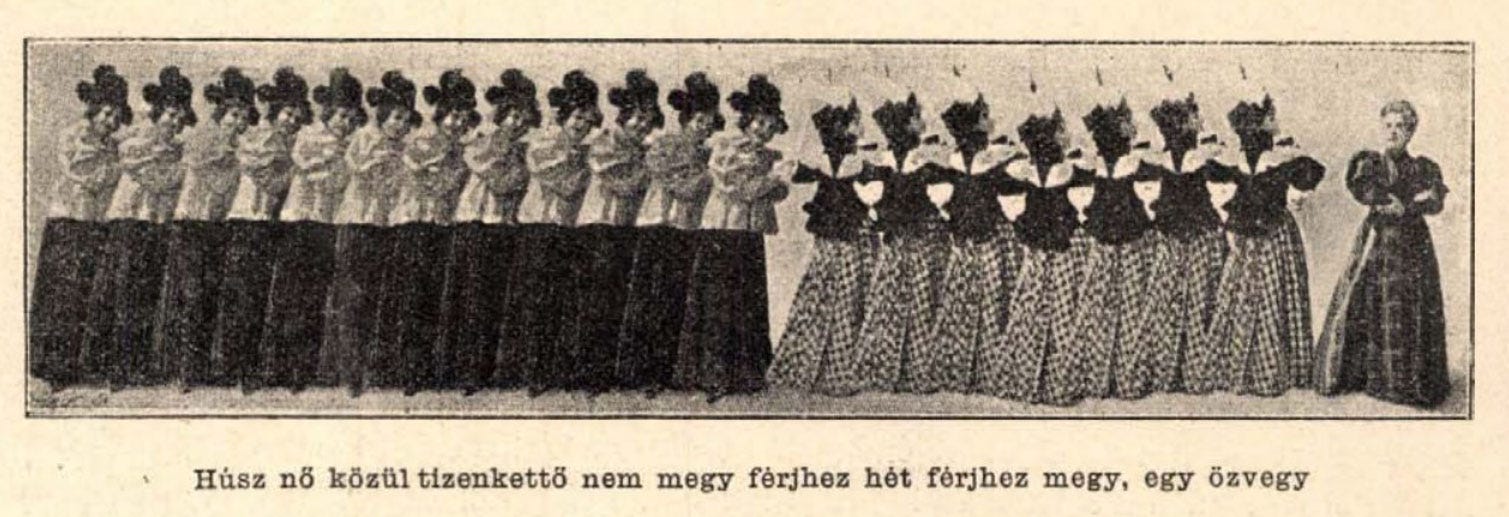
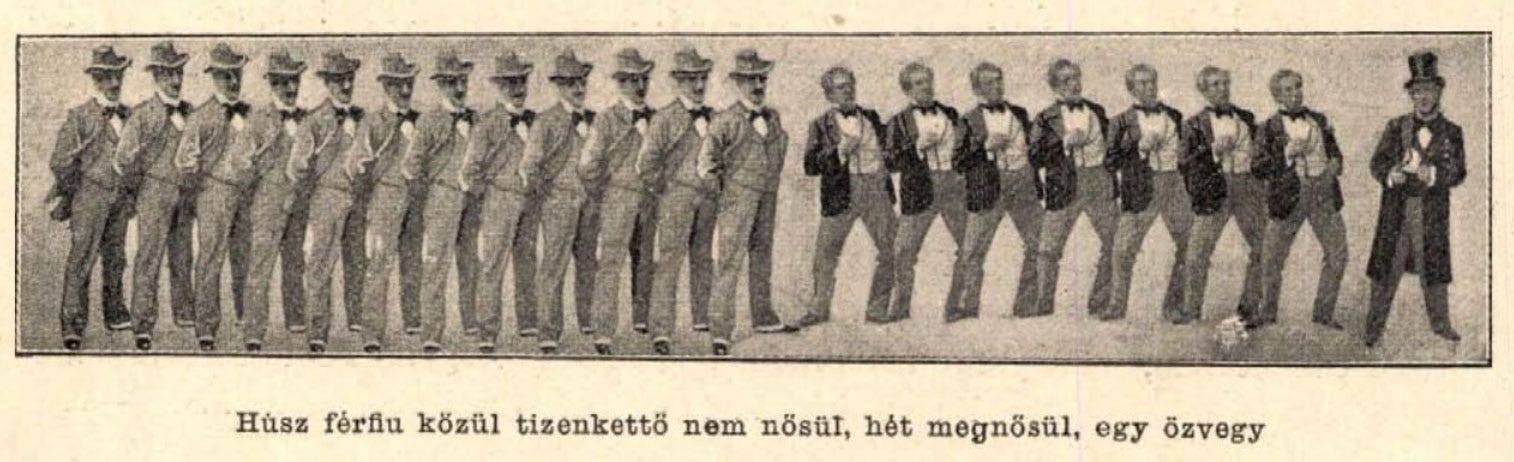
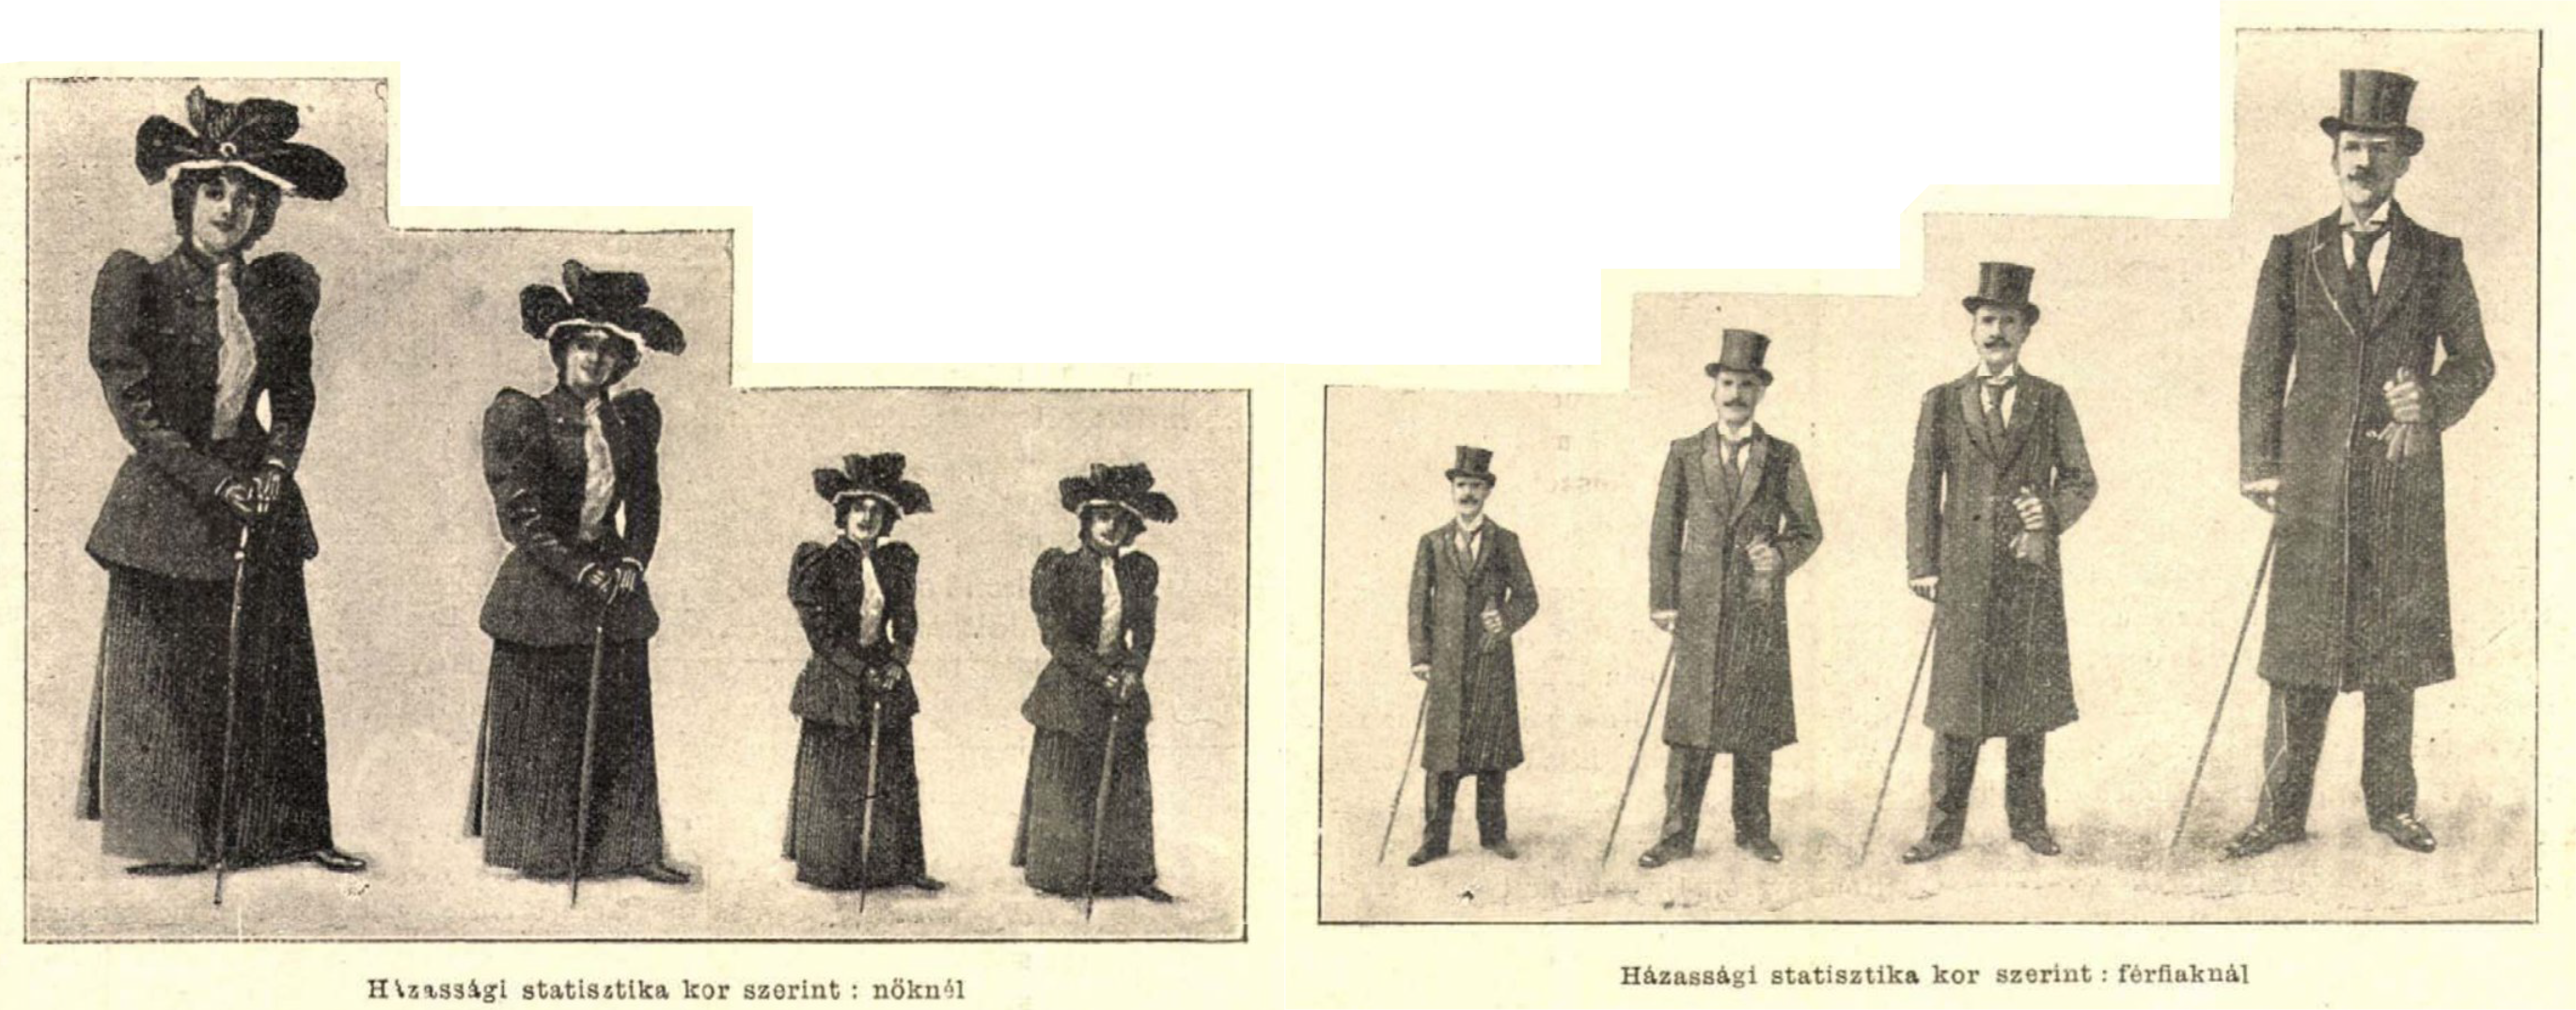
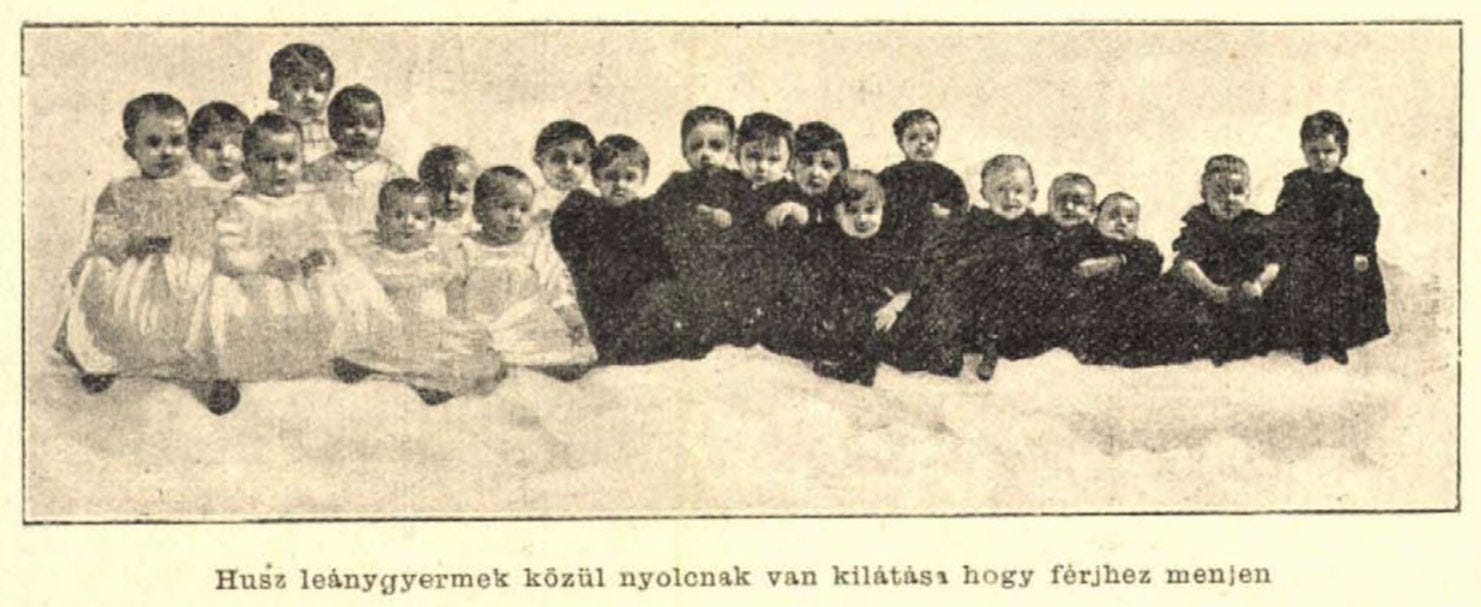
It is clear that most of them are based on photographs. The quality of the photographs deteriorated significantly when they were enlarged for presentation and then reprinted in the newspaper. Saint-Aubin used three methods to display the data. He placed photos showing individual types side by side, as in Isotype. He scaled them to each other. And he showed each child as an individual character - as in modern figure-visualizations. Unfortunately, it is not known whether the original photos were taken specifically for the purpose of data display. If you know more, please write it in the comments!
If you are curious about how to present data with photos and photomontages, I recommend Nicholas Felton’s book PhotoViz!
Next time our destination is Australia, where we will look at some very special data maps.

That this was all undoubtedly compiled and cut by hand makes it so much more impressive